Download
1 / 41
410 likes | 415 Views
This paper examines the relationship between globalization, export-led growth, and inequality in East Asian countries. It highlights the stylized facts on rising inequality and analyzes the forces of globalization and national policies that contribute to worsening inequality. The paper also discusses the limits and challenges of export-led growth and explores alternative policies and strategies to address inequality.

E N D
Globalization, Export-Led Growth and Inequality: The East Asian Story Mah Hui Lim Penang Institute limmahhui@gmail.com Sanya University 22-24 February 2016
OUTLINE • Stylized facts on rising inequality • Forces of Globalization & National Policies • Trend & reasons for worsening inequality in each country • Limits & Challenges of Export Led Growth • Alternative Policies & Strategies
Section I - Inequality • Issue of inequality return with vengence – failure of trickle down growth –13 of 36 Asian ctries Gini>40 • Inequality not just distribution of personal incomes, opportunities & outcomes, technology • Focus on functional income distribution – distribution of national income to capital vs labor
Functional Income Distribution (FID) worsening • Since 1990s, ¾ of 69 countries for which FID data are available experienced declining wage share* (WS) of income. • On avg in Asia WS declined by 20 percent since 1994 • * Wage share and labor share used interchangeably
Worsening FID driven by two sets of forces • Exogenous - Globalization forces • Endogenous - Policy driven forces • Export-Led Growth reflects both these forces
Globalization – Trade & Financial, Technology • Mainstream view– world trade improves equality – exports pull up wages in LDCs with labor endowment • Technology > freer flow of capital & info > decrease inequality • Above not supported by evidence
Heterodox view – political economy • Trade openness accompanied by financial openness-worsens inequality • Main factor – K more mobile than labor - flow to wherever wages are lower > downward pressure, worsened by national policies • Change in bargaining power btw lab & capital. Emph redistribution of rents
Heteredox -Globalization Forces • Financial liberalization/deregulation > frequent currency and econ crises • FX deprcn and econ recession – more negative & lasting effects on labor thru erosion of wages via prices & bargaining power, e.g. Korea during Asian financial crisis
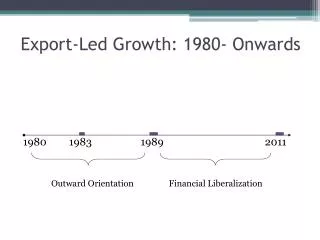
Section II – East Asian Story • China, Korea, Taiwan (PoC), Malaysia and Thailand • High growth rates avg 6%-11% p.a. but • Gross export growth higher @ 7%-20% • Definition of Export Led Growth (ELG) • ELG = periods when gross export growth > GDP growth; can have current account deficit • Most periods are ELG
Export-Led Growth Periods (in red) = GDP growth – Export Growth
Growth with Declining Wage Share (WS) in all 5 economies • Because wage growth is lagging behind productivity growth resulting in declining wage share • Most productivity captured by capital rather than labor
Falling Wage Share • Steepest for China of over 12% • Malaysia & Thailand lowest level of WS (ard 30%), secular decline for Msia & stagnating for Thailand • Taiwan significant decline ard 10% • Korea – decline after 1996, recovered slightly after 2000 but down again after 2007
Reasons for Inequality & Falling Wage Share • Trend mirrored in real wage growth falling behind prodtvy growth • Not marginal prodtvy but pol, econ, soc forces, at global & national level, can better explain rising inequality
Summary of E Asian ELG policy • China, Malaysia, Thailand follow labor intensive ELG based on repressing labor & unit labor cost to attract FDI • Korea ELG based more on technology r/t wage comptn; nevertheless WS declined after fin libzn & crisis • Taiwan – in btw 2 camps. Started off like Korea but > 1990 changed to “cost-down” strategy with opening of China & massive invst moved to Ch
China- extreme case of ELG based on pushing down unit labor cost -wage competiveness strategy • Indzn & export based on cheap lab fr rural sector • Explicit policies to discriminate against migrant labor; prohibit trade union except state sponsored • 1996-2007 – productivity rose 2x real wages 19% vs 11% • Worsened after China joined WTO
China: Labor Productivity vs Real Wages in Industry, 1995-2010
Chinese ELG policy based on exploitation of agr & rural sectors • Massive capital transfer from agriculture to industry plus from rural to urban sectors amounted to a total of Rmb 4.3 trillion btw 1978 & 2000
China-Yearly Capital Transfer fr Agr to Industry and Rural to Urban (in Rmb Bn) Source: Huang,Rozelle,Wang, 2006, Table 6
Malaysia and Thailand – also ELG based on wage comptve • Msia & Thailand – ELG since 70s but diffnt fr Korea & Taiwan • High foreign direct investment • High import content; few linkages • Dependent on foreign market • Poor or no industrial policy
Msia & Thailand • Incentives for FDI –tax holiday, low impt duties, prov infrastrcuture, • Repressive lab laws – unions banned in export inds; no minimum wage until 2012/13; right to strike prohibited • Lacking technology, participate in low end of global supply chain
Taiwan-From Technology to Labor Competitiveness ELG • Up to 1990s, labor reaped large part of prodtvy gains • Wage Share rose fr 50% to 54% (1980 to 1994) • Gini dropped fr 0.4 to 0.3 in 1990s • Things changed > 1990 with opening up of China to FDI • Taiwan invsted heavily in China & adopted “cost-down” strategy
Taiwan • One million skilled workers & professionals moved to China • Taiwan imported cheap foreign labor • Technology development trailed behind Korea • All these put pressure on wage > declining WS
Korea- WS declined after financial liberalization & crisis • Korea ELG based on domestic cap, technology purchase • <1990s, real wages rose with prodtvy • WS rose from 33% (1970) and peaked at 49% (1996), then declined • Turning point financial liberalization & Asian Fin Crisis – opportunity state & cap to extract concessions from labor > rise in temp emplyt & unemplyt
Section III- Limits & Challenges of Export Led Growth • 2007 global fin crisis (GFC) exposed weakness & limits of ELG – higher ext vulnerability; dom rising inequality • Wage- not only a cost item; also source of aggr demand • Drop in WS impacts negatively dom consumption & aggregate demand • ELG is one way to escape stagnating dom demand arising fr declining WS
Inequality contributes to global imbalance • Current acct surplus of one ctry shows up in cur acct deficit of others • CAS of China & CAD of U.S.-2 sides of same coin • In U.S. falling WS counteracted with rising household debt > fin crisis • In China – falling WS made up for with rising exports • Both unstable & unsustainable
Korea & Malaysia – also taking the debt route • Parallel to fall in WS, Korea’s household savings rate plunged from 26% (1988) to 0.4% (2002). Now hovers around 2%-3% • Household debt rose at 13% p.a. twice GDP growth rate > 89% of GDP in 2011 • Household debt / HH disposable income at 164% in 2012
Malaysia –same story but worse – slowing prodtvy growth • WS dropped from 47% (1970s) to 30% in 2008 • Private consptm supported by debt, not rising income • Msia prodtvy growth is slowing down - early deindustrialization
Section IV – Alternative Policies & Strategies • Ctries esp China trying to orientate to dom demand to stimulate growth • But need to restructure their productive, distributive, redistributive systems
Restructure Distributive System • Align wage rise to prodtvy growth + inflation • Instead of race to bottom in wage comptn, coordinate wage policies btw countries
Restructure Redistributive System • More progressive tax structure • Reduce tax bias now favoring capital • Increase capital gains tax – esp graduated cap gains tax – higher tax for short term cap gains • China sh reduce over invst in phy infrast & incr invst in social infra – health, educn, social safety net
Restructure Productive System • Productive structure – move away fr just vertical specialization in global supply chain to horizontal specialization • More intra-regional trade in final goods