Download
1 / 17
180 likes | 507 Views
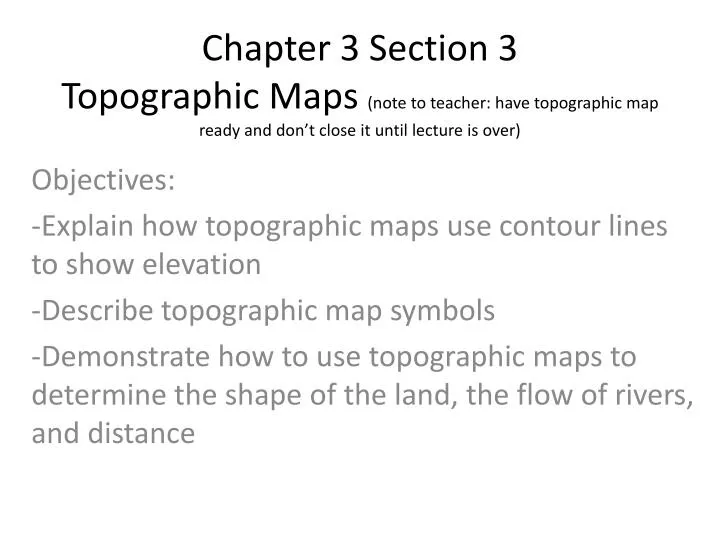
Chapter 3 Section 3 Topographic Maps (note to teacher: have topographic map ready and don’t close it until lecture is over). Objectives: -Explain how topographic maps use contour lines to show elevation -Describe topographic map symbols

E N D
Chapter 3 Section 3Topographic Maps (note to teacher: have topographic map ready and don’t close it until lecture is over) Objectives: -Explain how topographic maps use contour lines to show elevation -Describe topographic map symbols -Demonstrate how to use topographic maps to determine the shape of the land, the flow of rivers, and distance
Topography - • The natural and human-made surface features of an area.
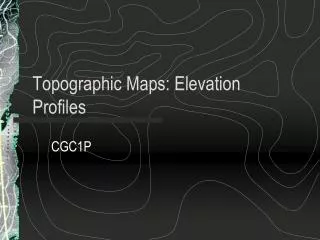
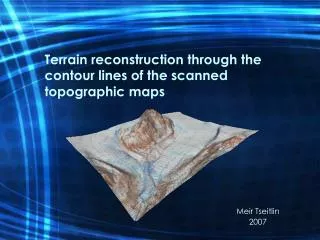
Topographic Maps • Common type is the 7.5 minute map commonly called a quadrangle, that spans 7.5 minutes of latitude and 7.5 minutes of longitude • Topographic Map of Sedona
7.5 Minute Map • Has a scale of 1:24,000 • (one inch represents 2,000 ft.)
Topographic Maps Con’t • Contour lines – narrow brown lines that indicate elevation • Topo • Contour Interval – The difference in elevation between consecutive contour lines. • contour interval 40
Calculating Contour Interval • Subtract 2 adjacent bold contour lines and divide by the number of lines • 200-100=100 • 5 contour lines • 100/5=20 • C.I. = 20 ft
Slope • The distance between one contour line and the next indicates steepness. • Contour lines that are close together = steep • Contour lines with space between them = gradual • Rise/Run = average slope
Bench Marks • The exact location where elevation is known and noted on a brass or aluminum plate which is permanently set into the ground • On a map it is noted with “BM” next to a X with the elevation given. • benchmark
Spot Elevations • Elevations of road forks, hilltops, lake surfaces, and other points of interest. • Marked with small crosses “+” • spot elevations
Understanding Symbols • Contour lines that form circles indicate hills or mountains • Depression contours indicate a depression in the landscape
Other features • Contour lines that cross a river from an arrow which points toward the source • Human made features are depicted in black • Thickly settled regions are pink
Magnetic Declination • The angle by which a compass needle will vary from true north