Download
1 / 37
370 likes | 389 Views
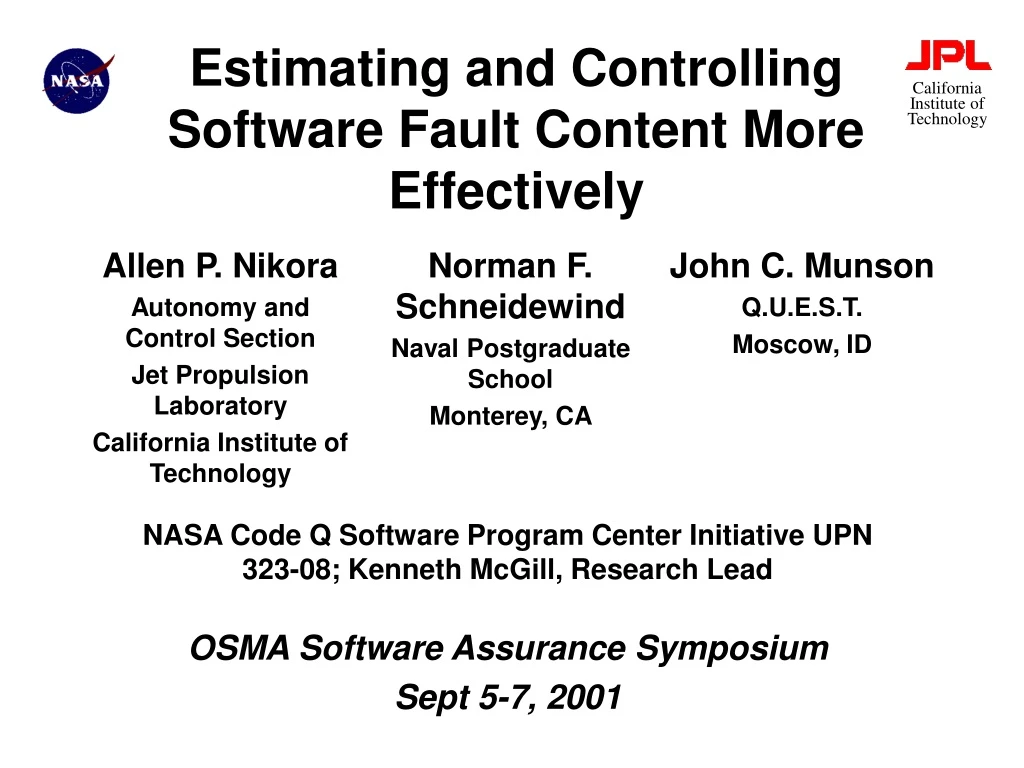
Estimating and Controlling Software Fault Content More Effectively. NASA Code Q Software Program Center Initiative UPN 323-08; Kenneth McGill, Research Lead OSMA Software Assurance Symposium Sept 5-7, 2001. Topics. Overview Benefits Preliminary Results Work in progress References

E N D
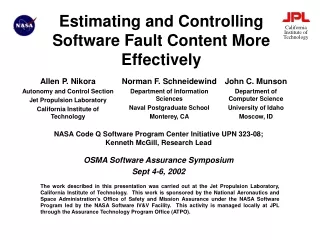
Estimating and Controlling Software Fault Content More Effectively NASA Code Q Software Program Center Initiative UPN 323-08; Kenneth McGill, Research Lead OSMA Software Assurance Symposium Sept 5-7, 2001
Topics • Overview • Benefits • Preliminary Results • Work in progress • References • Backup information
26 4 142 37 6 75 Source Code Modules ... ... ... Source Code Modules 1.5 1 2 1 2 1.5 41 ConditionalExecutionFaults ExecutionOrderFaults 258 5 Lines ofSourceCode MaxNestingDepth 3 1 1 ... ... 2 VariableUsageFaults TotalOperands IncorrectComputation ... 3 ... 3 1.9 1.25 ... 3.5 ... 3 4 3 Overview Objectives: Gain a better quantitative understanding of the effects of requirements changes on fault content of implemented system. Gain a better understanding of the type of faults that are inserted into a software system during its lifetime. planning (e.g., time to allocate for testing, identify fault prone modules)guidance (e.g., choose design that will lead to fewer faults)assessment (e.g., know when close to being done testing) Use measurements to PREDICT faults, and so achieve better Structural Measurementsof Specification Structural Measurementsof Source Code Estimated Fault Counts by Type for Implemented System 3 Numbers of estimated faults of given type in given module 2 ComponentSpecifications … ... Measure-ments of given type for given module 5 Number ofExceptions FunctionCount types of measurements types of faults types of measurements EnvironmentalConstraints
Overview: Goals • Quantify of the effects of requirements changes on the fault content of the implemented system by identifying relationships between measurable characteristics of requirements change requests and the number and type of faults inserted into the system in response to those requests. • Improve understanding of the type of faults that are inserted into a software system during its lifetime by identifying relationships between types of structural change and the number and types of faults inserted. • Improve ability to discriminate between fault-prone modules and those that are not prone to faults.
Overview: Approach • Measure structural evolution on collaborating development efforts • Initial set of structural evolution measurements collected • Analyze failure data • Identify faults associated with reported failures • Classify identified faults according to classification rules • Identify module version at which each identified fault was inserted • Associate type of structural change with fault type
Overview: Approach(cont’d) • Identify relationships between requirements change requests and implemented quality/reliability • Measure structural characteristics of requirements change requests (CRs). • Track CR through implementation and test • Analyze failure reports to identify faults inserted while implementing a CR
Overview: StructuralMeasurement Framework Fault Measurement and Identification Structural Measurement Compute Fault Burden
Overview: RequirementsRisk to Quality • Based on risk factors evaluated when changes to STS on-board software are under consideration • Risk Factors – see backup slides for more detail • Complexity • Size • Criticality of Change • Locality of Change • Requirements Issues and Function • Performance • Personnel Resources • Tools
Overview: Status • Year 1 of planned 2-year study • Installed initial version of measurement framework on collaborating JPL development efforts • Mission Data System (MDS) • Possible collaboration with ST-3 (Starlight) software development effort • Investigated use of Logistic Regression Functions (LRFs) in combination with Boolean Discriminant Functions (BDFs) • Improve accuracy of quality and inspection cost predictions
Benefits • Use easily obtained metrics to identify software components that pose a risk to software and system quality. • Implementation – identify modules that should have additional review prior to integration with rest of system • Prior to implementation – estimate impact of changes to requirements on quality of implemented system. • Provide quantitive information as a basis for making decisions about software quality. • Measurement framework can be used to continue learning as products and processes evolve.
Preliminary Results: Quality Classification • Investigated whether Logistic Regression Functions (LRFs), when used in combination with Boolean Discriminant Functions (BDFs), would improve the quality classification ability of BDFs when used alone. • When the union of a BDF and LRF was used to classify quality, the predicative accuracy of quality and inspection cost was improved over that of using either function alone for the Space Shuttle. • The significance is that very high quality classification accuracy (1.25% error) can be obtained while reducing the inspection cost incurred in achieving high quality.
Preliminary Results: Quality Classification • For the same software system and using the same set of metrics, BDFs were superior to LRFs for quality discrimination. • LRFs used in isolation were of limited value. • However, when combined with BDFs, LRFs provided a marginal improvement in quality discrimination for low quality modules. • When LRFs are added, inspection cost is reduced from that incurred when BDFs are used alone. • This is a significant finding in terms of providing an accurate quality predictor for safety critical systems at reasonable cost.
Preliminary Results: Quality Classification • The ranking of Pi provided accurate thresholds for identifying both low and high quality modules. • The method for determining the critical value of LRFs, using the inverse of the Kolmogorov-Smirnov (K-S) distance, provided good balance between quality and inspection cost. • The results are encouraging but more builds should be analyzed to increase confidence in the results. • The methods are general and not particular to the Shuttle. • Thus, the methods should be applicable to other domains.
Preliminary Results: FaultTypes vs. Structural Change • Structural measurements collected for one subsystem of MDS • 375 source files • 976 unique modules • 38298 total measurements made • Fault index and proportional fault burdens computed for each unique module • Domain scores computed for each version of each module
Work in progress • Analyze MDS failures to identify faults • Identify module and version where fault was inserted • Determine fault type • Relate fault type to structural change type (domain scores from PCA) • Relate requirements changes to implemented quality • Measure change request • Identify changes to source code modules that implement change request • CM system based on “change packages” – one change package per change request • Measure structural changes to source modules implementing change: R C F • Identify number and type of faults occurring in implemented change request
Quality Classification • Metric Ranking • The critical values derived from applying the Kolmogorov-Smirnov (K-S) Distance method are shown in Table 1. • Metrics were entered incrementally in the BDFs and LRFs in the sequence given by the K-S ranks in Table 1. • A graphical picture is shown in Figure 1. • Figure 2 shows the plot of drcount versus Pi. • Where Pi is the probability of drcount>0 • Both figures indicate the critical value of Pi.
Quality Classification (cont’d)Kolmogorov-Smirnov (K-S) Distance
Quality ClassificationBDF – LRF Validation Predictions and Application Results • Tables 2 (validation predictions) and 3 (application results) provide a comparison of the ability of BDFs and LRFs to classify quality and the inspection cost that would be incurred. • BDF LRF is the superior quality classifier as shown by the highlighted (red) cells.
Quality Classification (cont’d)BDF – LRF Validation Predictions,BDF – LRF Application Results
Quality Classification (cont’d)LRF Validation Predictions • Table 4 indicates that there is not a statistically significant difference between the medians of Pi and drcount at the indicated a for both the four and six metric LRFs (i.e., large alpha for result). • We performed an additional analysis to determine the percentage of drcount corresponding to the highest and lowest 100 ranks of Pi, using Build 1. The predictions are shown in Table 4 for the four and six metric cases.
Quality Classification (cont’d)Ranks of Pi (probability of drcount>0) • The purpose of this analysis was to establish a predictor threshold (i.e., highest 100 ranks of Pi) of the lowest quality modules in the Application product (Build 2). • Figure 3 shows drcount versus the rank of Pi for the four metric LRF for Build 1.
STS Software Requirements Change Risk Factors • Definitions of the risk factors evaluated when a change to the STS on-board software is under consideration are given on the following slides. • If the answer to a yes/no question is "yes", it means this is a high-risk change with respect to the given factor. • If the answer to a question that requires an estimate is an anomalous value, it means this is a high-risk change with respect to the given factor.
STS Software Requirements Change Risk Factors (cont’d) • Complexity Factors • Qualitative assessment of complexity of change (e.g., very complex) • Is this change highly complex relative to other software changes that have been made on the Shuttle? • Number of modifications or iterations on the proposed change • How many times must the change be modified or presented to the Change Control Board (CCB) before it is approved?
STS Software Requirements Change Risk Factors (cont’d) • Size Factors • Number of lines of code affected by the change • How many lines of code must be changed to implement the change? • Size of data and code areas affected by the change • How many bytes of existing data and code are affected by the change?
STS Software Requirements Change Risk Factors (cont’d) • Criticality of Change Factors • Whether the software change is on a nominal or off-nominal program path (i.e., exception condition) • Will a change to an off-nominal program path affect the reliability of the software? • Operational phases affected (e.g., ascent, orbit, and landing) • Will a change to a critical phase of the mission (e.g., ascent and landing) affect the reliability of the software?
STS Software Requirements Change Risk Factors (cont’d) • Locality of Change Factors • The area of the program affected (i.e., critical area such as code for a mission abort sequence) • Will the change affect an area of the code that is critical to mission success? • Recent changes to the code in the area affected by the requirements change • Will successive changes to the code in one area lead to non-maintainable code? • New or existing code that is affected • Will a change to new code (i.e., a change on top of a change) lead to non-maintainable code? • Number of system or hardware failures that would have to occur before the code that implements the requirement would be executed • Will the change be on a path where only a small number of system or hardware failures would have to occur before the changed code is executed ?
STS Software Requirements Change Risk Factors (cont’d) • Requirements Issues and Function Factors • Number and types of other requirements affected by the given requirement change (requirements issues) • Are there other requirements that are going to be affected by this change? If so, these requirements will have to be resolved before implementing the given requirement. • Possible conflicts among requirements changes (requirements issues) • Will this change conflict with other requirements changes (e.g., lead to conflicting operational scenarios) • Number of principal software functions affected by the change • How many major software functions will have to be changed to make the given change?
STS Software Requirements Change Risk Factors (cont’d) • Performance Factors • Amount of memory required to implement the change • Will the change use memory to the extent that other functions will be not have sufficient memory to operate effectively? • Effect on CPU performance • Will the change use CPU cycles to the extent that other functions will not have sufficient CPU capacity to operate effectively?
STS Software Requirements Change Risk Factors (cont’d) • Personnel Resources Factors • Number of inspections required to approve the change. • Workforce requirements required to implement the change • Will the manpower required to implement the software change be significant? • Workforce required to verify and validate the correctness of the change • Will the workforce required to verify and validate the software change be significant?
STS Software Requirements Change Risk Factors (cont’d) • Tools Factor • Any software tools creation or modification required to implement the change • Will the implementation of the change require the development and testing of new tools? • Requirements specifications techniques (e.g., flow diagram, state chart, pseudo code, control diagram). • Will the requirements specification method be difficult to understand and translate into code?