Download
1 / 32
320 likes | 440 Views
Agent Based Pharmacometric and Physiologic Insights. Meyer Katzper January 2007 2007 International Conference on Health Sciences Simulation. Purpose To show some initial experiments with Agent Based Computing (ABC) as applied to diffusion, PK and PD Talk Content Motivation/Background

E N D
Agent Based Pharmacometric and Physiologic Insights Meyer Katzper January 2007 2007 International Conference on Health Sciences Simulation
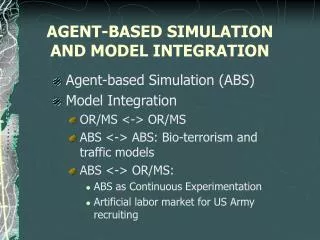
Purpose To show some initial experiments with Agent Based Computing (ABC) as applied to diffusion, PK and PD Talk Content Motivation/Background Explanation of ABC Demonstration of NetLogo aspects Diffusion PK results PD results Evaluation, Prospects and Challenges
Motivation/Background Agent Based Computing (ABC) assumes that there are many independent agents who follow algorithmic rules of interaction with each other and with different types of agents. Such a scheme is attractive for modeling many biological processes. Processes such as the immune system defense of the body lend themselves to such an approach. Sample references of such applications are provided later. To familiarize myself with the ABC system I eventually decided to master, I decided to experiment with an area I knew so as to be clear as to the strengths and weaknesses of ABC. For this purpose I chose to look at some PK and PD models. I was also interested in attempting non-compartmental models. Specifically, I desired to study non-homogeneous spatial distribution which otherwise would involve using partial differential equations. Note --- The novel Prey by Michael Crichton starts out discussing software to coordinate the actions of large groups of autonomous agents.
Example of Agent Based Computing ABC more generally known as Agent Based Programming. Taken from http://www.red3d.com/cwr/boids/ This is the BOIDS model as formulated by its creator: The basic Boids flocking model consists of three simple steering behaviors which describe how an individual boid maneuvers based on the positions and velocities its nearby flockmates: Separation: steer to avoid crowding local flockmates Alignment: steer towards the average heading of local flockmates Cohesion: steer to move toward the average position of local flockmates Output is not shown here. Scientific American Amateur Scientist, November 2000 ARTIFICIAL LIFE: Boids of a Feather Flock Together Shawn Carlson explains how to simulate simple organisms on your computer
Algorithmic underpinning of BOIDs Separation: steer to avoid crowding local flockmates Alignment: steer towards the average heading of local flockmates Cohesion: steer to move toward the average position of local flockmates
There are a number of free and freely available programs which can implement agent-based modeling like Boids. Some of these are; Swarm MASON NetLogo StarLogo visualbots Software http://www.swarm.org/wiki/Tools_for_Agent-Based_Modelling http://www.geosimulation.org/geosim/abms.htm#programming Papers http://www.swarm.org/wiki/Agent-Based_Models_in_Biology_and_Medicine
Excerpt from In pixels and in health: computer modeling pushes the threshold of medical research Science News, Jan 21, 2006 by Naila Moreira Moment by moment, a movie captures the action as a group of immune cells scrambles to counter an invasion of tuberculosis bacteria. Rushing to the site of infected lung tissue, the cells build a complex sphere of active immune cells, dead immune cells, lung tissue, and trapped bacteria. Remarkably, no lung tissue or bacterium was harmed in the making of this film. Instead, each immune cell is a computer simulation, programmed to fight virtual tuberculosis bacteria on a square of simulated lung tissue. In their computer-generated environment, these warrior cells spontaneously build a structure similar to the granulomas that medical researchers have noted in human lungs fighting tuberculosis. The simulation was created by Denise Kirschner of the University of Michigan in Ann Arbor.
Gary An has published widely with this approach An G. Concepts for developing a collaborative in-silico model of the acute inflammatory response using agent based modeling. J Crit Care 2006; 21(1): 105-110. An G. Mathematical modeling in medicine: A means not an end. Crit Care Med 2005; 33(1): 253-254. (Editorial) Vodovotz Y, Clermont G, Chow C, An G. Mathematical models of the acute inflammatory response. Cur Opin Crit Care 2004; 10:383-390. An G. In-silico experiments of existing and hypothetical cytokine-directed clinical trials using agent based modeling. Crit Care Med 2004; 32(10): 2050-2060.. An G. Agent-based computer simulation and SIRS: Building a bridge between basic science and clinical trials. Shock 2001; 16(4): 266-273. An G, Lee I. Agent-Based Computer simulation (ABCS) and the inflammatory response: Building a tool to study Systemic Inflammatory Response Syndrome (SIRS).Simulation and Gaming 2001; 32(3): 344-361. An G, Lee I. Complexity, Emergence and Pathophysiology: Using Agent Based Computer Simulation to characterize the Non-Adaptive Inflammatory Response. InterJournal Complex Systems: http://www.interjournal.org. Manuscript # [344]. May, 2000.
D. Y. Wong, A. Qutub, and C. A. Hunt. "Modeling Transport Kinetics with StarLogo." Proc. 26th Annual International Conference IEEE Engineering in Medicine and Biology Society (EMBS), Sept. 1-5, 2004.
The following Netlogo interface shows a diffusion of agents who started out uniformly at the leftmost Y coordinate and are moving randomly.
Data for histogram at given point in time. This case is for all elements starting centrally and diffusing outward randomly.
If initially all particles are at some asymmetric location but they move randomly for sufficient time in a confined area they become fairly uniformly distributed. For a well distributed system the histogram gives a reasonable representation of the location of the particles.
If however one starts with an unsymmetrical concentration, say at the top right corner (without wrapping) the evolution of the particle positions is quite different. However, the histogram still provides a reasonable representation of what is occurring in the system.
If the particles are arranged in a circle, the histogram gives a completely wrong impression of the particle distribution. The lower representation looks better but is probably and artifact of scale and grouping interval.
If we let the particles diffuse, the histogram continues to give an erroneous representation of particle position.
PK and PD are long established disciplines that use lumped parameter models to approximate drug concentration and effect versus time. In the simplest PK case the entire body is considered one compartment from which a given drug is cleared in proportion to its concentration. If we call the proportionality constant K the governing differential equation is dC/dt = - K*C where C is the concentration. In our agent based approach we will specify N, the number of particles. N/V would give the concentration.
Clearance experiments with NetLogo Initial study of clearance of drug dose as a form of predation with destructive agents taking the place of physiologic processes which eliminate drugs. Look at drug administration as an introduction of N particles into a fixed volume. Look at clearance as effected by M agents also randomly moving in the same volume and eliminating any drug particle they encounter. Experiment Fix the drug dose (N=100). Vary M the eliminating agents. Track dose half life T1/2 as F(M). As will be seen there is a large degree of randomness in this process.
NetLogo results. Drug entities are the white circles. Clearance entities are the black triangles Early in elimination process, Later in elimination process,
Demo of dose elimination. T 1/2 is a more stable measure than the endpoint which has great variability Dose of 100 and dose clearance agents 20 in this case. Here T 1/2 is 98 time interaction units. Graph shows concentration vs time.
Dose 100. Agents 20. Stochastic nature of clearance versus time is demonstrated by this sample of 4 identically specified runs.
Demonstration of dose independence of T ½ in this model. Statistics for only one hundred runs each for dose 100 and dose 200. 20 dose clearance agents used in each case.
The frequency graph below is for one hundred runs with each run for dose 100 with 20 dose clearance agents.
The frequency graph below is for five hundred runs each run for dose 100 with 20 dose clearance agents. Y axis is the frequency of T1/2 values which are shown on the X axis.
Two samples of initial distributions for simulation run of a model of a drug to eliminate germs. Dose of 100. 20 Clearance agents. 240 germ patches.
Drug eliminates germ patches. Clearance agents eliminate drug. Graph shows time course up to this point. This case is a highly effective antibiotic. Picture is for the last time point in the graph.
Drug eliminates germ patches. Clearance agents eliminate drug. Graph shows time course up to this point. This case is a highly ineffective antibiotic.
Germ elimination ½ life for drug N= 100 Clearers N = 20 Frequency count from 100 NetLogo runs. Time units NetLogo ticks.
Time for ½ the germ burden to vanish a a function of dose. Note – In diseases like HIV data on viral load and dose are available.
Time for ½ the germ burden to vanish a a function of dose. Two sets of runs with doses from 10 to 100.
Evaluation, Prospects and Challenges Our models are metaphors for reality. With the agent based metaphor we can examine reality in another way. This exercise was intended to explore the strengths and weaknesses of the NetLogo agent based modeling platform. I have compared it with other platforms and found it to be the most user friendly. I intend to explore metabolic and immunologic questions using NetLogo. The effects of non-uniform distributions of substances can also be studied. How feasible and how much effort this will take remains to be seen. After the challenge of formulating the model there is the challenge of transforming the observations to match the classical values that are in current use.