Download
1 / 31
310 likes | 339 Views
Explore proposed and transitioning ionosphere products including absorption upgrades, positioning corrections, and short-term forecasts at SWPC/NOAA workshops. Dive into absorption response to solar flares, combined flare and Polar Cap Absorption data, and innovative algorithms.

E N D
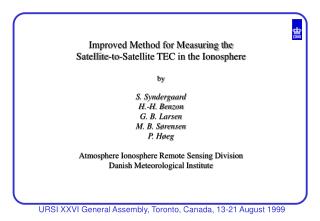
New Ionosphere Products Proposed for SWPCTim Fuller-Rowell, Mihail Codrescu, Rashid Akmaev, Eduardo Araujo-Pradere, Mike Husler, and Herb Sauer1NOAA Space Weather Prediction Center and/or CIRES University of Colorado1National Geophysical Data Center SWPC/NOAA SWW Workshop
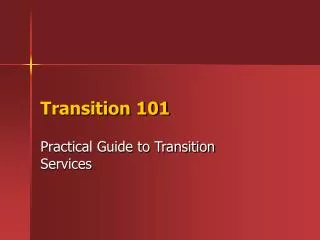
New SWPC “Ionosphere” Products:in transition or proposed • D-Region absorption upgrade - FY08 • GPS Ionosphere Positioning Correction (GIPC) - FY08 • US-TEC short-term forecast - FY09 SWPC/NOAA SWW Workshop
New SWPC “Ionosphere” Products:in transition or proposed • D-Region absorption upgrade - FY08 • GPS Ionosphere Positioning Correction (GIPC) - FY08 • US-TEC short-term forecast - FY09 SWPC/NOAA SWW Workshop
D-Region absorption in response to solar X-ray flare Driver: GOES X-rays • Dayside response to flare • Zenith angle dependence • Frequency dependence • Estimated recovery time based on current X-ray flux SWPC/NOAA SWW Workshop
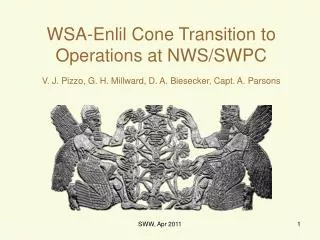
Combined flare and Polar Cap Absorption (PCA)(Provided by Michael P. Husler, NOAA SEC)June 21, 2000 00:00 UT Kp= 3Color scale denotes frequency at which the ionospheric absorption equals 1 dB SWPC/NOAA SWW Workshop
Day/NightAbsorption Algorithms developed by Sellers et al* Provides 30 MHz absorption estimates Driven by proton fluxes obtained in real-time by NOAA GOES Day/night differences due to electron attachment to O2 in absence of UV radiation Day-time Abs Ad = 0.115 [ J(E>5.2 MeV)]1/2 dB Night-time Abs An = 0.020 [J(E>2.2 MeV)]1/2 dB *Sellers, B., F.A.Hanser, M.A. Stroscio, and G.K.Yates, The night and day relationships between polar cap riometer absorption and solar protons, Radio Sci., v12, pp779-789, 1977. • Twilight absorption bi-linear fit to values at 10 solar elevation angle • A = Ad [ El + 10] / 20 – An [ El – 10 ] / 20 • Recovery time-scale based on current GOES flux levels
Geomagnetic Latitude Dependence- Determine Cutoff Energy Effects The absorption at lower than polar cap latitudes are obtained from application of geomagnetic cutoff energies which include their dependence on geomagnetic activity (Kp) as derived from the results of Smart et al* and illustrated below. *Smart, D.F., M.A.Shea, E.O.Fluckiger, A.J.Tylka, and P.R.Boberg., Changes of calculated vertical cutoff rigidities at the altitude of the International Space Station as a function of geomagnetic activity, Proc. Int’l Cosmic Ray Conf., v7, pp337-340, 2001
Frequency Dependence The absorption at a frequency, f, other than 30 MHz (Af) is obtained from the approximate dependence of ionospheric absorption on the inverse power law of the frequency (e.g.: Patterson et al*) Af = (30/f)1.5 A30 *Patterson, J.D., T.P.Armstrong, and C.M.Laird, Correlation of solar energetic protons and polar cap absorption, J.Geophys. Res., 106, A1, pp 149-163,2001.
Specimen Comparison with Observation: Thule 30 MHz Riometer Panel a): GOES particle fluxes. Panel b): Observed absorption with calculated day and night absorption Panel c): Observed and fully estimated absorption Panel d): Calculated solar elevation angles a) b) c) d)
Top panels: GOES particle fluxes. 2nd panels: Observed absorption with calculated day and night absorption 3rd panels: Observed and fully estimated absorption 4th panels: Calculated solar elevation angles Comparison of Calculation with observations provided by AFGL’s Thule Riometers for 11 largest events 1986-2002
Combined X-ray and PCA SWPC/NOAA SWW Workshop
Polar Region Display - 10dBPCA depends on solar illuminationO2 - e- attachment process in the D-region SWPC/NOAA SWW Workshop
New SWPC “Ionosphere” Products:in transition or proposed • D-Region absorption upgrade - FY08 • GPS Ionosphere Positioning Correction (GIPC) - FY08 • US-TEC short-term forecast - FY09 SWPC/NOAA SWW Workshop
US-TEC Target Users: • Positioning and Navigation community • Collaboration between SWPC, NGS, FSL, and NGDC • Kalman filter over CONUS + ground-based GPS data, IRI background model, solve for receiver biases • 15-minute cadence • 15 to 30 minute latency • 2 - 3 TEC unit accuracy (~34 - 48 cm delay at L1 frequencies) SWPC/NOAA SWW Workshop
Slant-Path TEC Maps 2-D maps of of slant path TEC over the CONUS for each GPS satellite in view updated every 15 minutes A B Sat. 1 A B Sat. 14 C A B C A B C Sat. 29 Sat. 5 C ….etc Applications: 1. Ionospheric correction for single frequency GPS 2. Support dual-frequency integer ambiguity resolution for more rapid decimeter and centimeter accuracy positioning C SWPC/NOAA SWW Workshop
A B Sat. 29 C Ionosphere phase delay/advance for NGS in new RINEX format US-TEC slant TEC provides ionospheric correctors for RINEX files SWPC/NOAA SWW Workshop
New SWPC “Ionosphere” Products:in transition or proposed • D-Region absorption upgrade - FY08 • GPS Ionosphere Positioning Correction (GIPC) - FY08 • US-TEC short-term forecast - FY09 SWPC/NOAA SWW Workshop
Mid-latitude day-to-day variability in ionospheric total electron content SWPC/NOAA SWW Workshop
The challenge in forecasting the ionosphere and total electron content 1hr forecast 0.9 2 hr forecast 0.8 12hrs 24hrs SWPC/NOAA SWW Workshop 15 minute units 15 min intervals
VTEC Short-term Forecast Using USTEC 10-day average to predict the ionospheric behavior in to the next 1 to 2 hours., USTEC 10-day average USTEC 15-min data Now Now-24 h D2 D1 D1 + D2 time Now+Dt Now-24+Dt Dt < 6hrs D1 – DTEC in the 10-average between the value at now-24 h and now-24+Dt D2 – Departure of “now value” from the 10-day average. SWPC/NOAA SWW Workshop
New SWPC “Ionosphere” Products:in transition or proposed • D-Region absorption upgrade - FY08 • GPS Ionosphere Positioning Correction (GIPC) - FY08 • US-TEC short-term forecast - FY09 SWPC/NOAA SWW Workshop
Latitude dependence SWPC/NOAA SWW Workshop
US-TEC Validation Summary Differential TEC: Slant = 2.4 TEC units Vertical = 1.7 TEC units “Absolute” FORTE ray tracing: Slant = 2.7 TEC units Vertical = 1.9 TEC units • Estimated US-TEC slant path total electron content uncertainty < 3 TEC units (equivalent to about 45 cm of signal delay at L1 frequencies) • Estimate US-TEC vertical total electron content uncertainty < 2 TEC units (equivalent to about 30 cm of signal delay at L1 frequencies) SWPC/NOAA SWW Workshop
******************************************************************************************************************************************************************************************************
“Differential” Validation • Integrate through US-TEC model at two different times. • Compare directly to the phase difference in the original RINEX data file. • As time separation increases, errors in US-TEC map become uncorrelated and approach true uncertainty. SWPC/NOAA SWW Workshop Araujo-Pradere et al. 2006
US-TEC “Differential” Validation Slant path RMSE IRI US-TEC • Validation stations not included in assimilation process • Build up statistics every 5th day over 6 months • Daily average RMSE for each site SWPC/NOAA SWW Workshop
Validation Statistics: “differential” TEC 2.4 TEC units
Absolute validation: FORTE Fast Onboard Recording of Transient Events satellite (Los Alamos, Abe Jacobson) • Phase or arrival time as function of frequency • Separate O and X traces • Fit to k/f2 dependence provides TEC estimate • Broad-band RF receiver 30-300 MHz at 800 km altitude • Designed to monitor lightning • Pulse transmitted from Los Alamos (simulated lightning) • Possible to estimate line-of-sight TEC between transmitter and FORTE satellite • Broad-band signal/receiver eliminates phase ambiguity so produces an “absolute” TEC estimate (uncertainty estimate is about 1 to 2 TEC units) • Issues are • bending of the rays, • plasmaspheric content, and having to • sub-sample US-TEC vertical domain Frequency Time of arrival SWPC/NOAA SWW Workshop
US-TEC/FORTE Statistics“Absolute”: using 178 FORTE observations between June 30, 2000, and November 27, 2001 • All values in TECU SWPC/NOAA SWW Workshop Minter et al. 2006
OPUS – GIPC (GPS Ionospheric Positioning Correction) TRANSITION: 4th quarter ‘08 SWPC/NOAA SWW Workshop