Download
1 / 26
260 likes | 287 Views
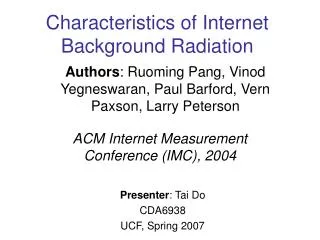
Characteristics of Internet Background Radiation. Authors: Ruomind Pang, Vinod Yegneswaran, Paul Bartfod, Vern Paxson, Larry Peterson Appeared in IMC 2004, Taormina, Sicily, Italy, October 2004 Presenter: Charles Ahern. Introduction.

E N D
Characteristics of Internet Background Radiation Authors: Ruomind Pang, Vinod Yegneswaran, Paul Bartfod, Vern Paxson, Larry Peterson Appeared in IMC 2004, Taormina, Sicily, Italy, October 2004 Presenter: Charles Ahern
Introduction • Older (mid 90’s) internet traffic studies make no mention of an appreciable amount of on-going nonproductive traffic • Today, this traffic, either malicious or benign (misconfigurations) is prevalent • The goal of this paper is to categorize this traffic, determine where it comes from and what it is doing
Outline • The magnitude of the problem • How to decide what traffic is “nonproductive” • Determining the nature of the traffic • Filtering • Responding (to gain further insight) • Brief Experiment Details • Quantifying & Qualifying • Weaknesses & Contributions
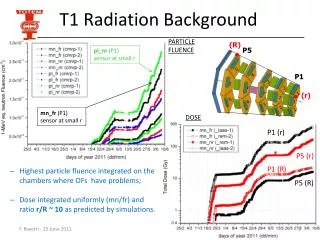
Magnitude • The magnitude of nonproductive traffic on the internet is not minor • Example: • Traffic logs from Lawrence Berkeley Laboratory (LBL) for an arbitrary day show: • 138 different remote hosts each scanned 25,000 or more LBL addresses for a total of over 8 million connection attempts • This is more than DOUBLE the site’s entire successfully-established incoming connections, originated by 47,000 distinct remote hosts
Given the traffic’s pervasive nature, they have termed it “Internet radiation”
Determining What is Unwanted • If we include all unsuccessful connection attempts, this will be an inaccurate statistic • Transient failures • Instead, measure traffic sent to hosts that don’t exist • Likely to eliminate most transient failures and yield unwanted activity • You can safely respond to this traffic
Taming the large Traffic Volume • Listening to traffic on thousands to millions of IP addresses… MUST handle efficiently • Nearly 30,000 packets per second of background radiation on the Class A network they are monitoring • Filtering schemes must be sound and effective
Filtering • Source-Connection Filtering • Keep first N initiated by the source • Disadvantages: • Inconsistent view of the network • N value is attack and service dependant • Source-Port Filtering • Keep first N connections for each source/destination port pair • Allows wider variety of activities • Still same downsides though
Filtering • Source-Payload Filtering • One instance of each type of activity per source • Good idea, hard to sometimes implement • Hard to tell if two activities are similar until several packets are responded to • Source-Destination Filtering (their choice) • Assume one source will try the same activities on every IP it tries to connect to
Responders • Highly efficient responder network • Found that most radiation is TCP SYN packets, which means they must respond • Approach to building responders was “data driven”: the determined which responders to build based on traffic volumes • Pick the most common form, build a responder • Once the traffic could be differentiated into specific types of activity, repeat with the next largest type of traffic
Responders Created • HTTP (port 80) • NetBIOS (port 137/139) • CIFS/SMB (port 139/445) • DCE/RPC (port 135/1025) • Dameware (port 6129) • MyDoom (port 3127) • Beagle (port 2745)
Responders • Responders need to stick to the protocol (“how” to say it) • They also need to know “what” to say to keep communication going • Differences in connections can be difficult to determine at the network or transport level, leading to needing an application level understanding required • Responses are developed manually, and many are intricate and take research to determine their format
Brief Experiment Details • Two separate network sites with two different systems iSink and LBL Sink. • Each system performed the same responses but used different underlying mechanisms
iSink • Class A network 224 addresses • And 2 /19 subnets (16k addresses) on two adjacent UW campus class B networks • One filter for each network • Filtered requests passed to the iSink • Did both passive (no responders) and active measurements
LBL Sink • Two sets of 10 contiguous /24 subnets • First is passive and unfiltered • Active analysis is divided into two sets of 5 subnets and filtered • All traffic then tunneled to a Honeyd responder
Quantifying Traffic rate breakdown by protocol (rate is number of packets per destination IP per day) Traffic breakdown by # of sources
Qualifying • Activities are ranked by number of source IP’s, not by byte or packet volume • Their filtering algorithm is biased to a source IP that tries to reach too many destinations • The number of source IP’s reflects the popularity of the activity across the internet • Single-source activities might be eccentric, while multi-source activity is more likely to be intentional
Qualifying • To qualify activities, all connections between a source-destination pair on a given port are looked at • Only common ports are considered • What about uncommon ports???
Ports • Background radiation traffic is highly concentrated on popular ports. • Example, on Mar 29, they saw 32,072 distinct source IP’s at LBL and only 0.5% of the source hosts contacted a port not among “popular” ports they monitored • Thus by only looking at popular ports, most internet radiation is monitored
Weaknesses • IP addresses were heavily used in filtering and statistical analysis. Because DHCP servers can assign different IP addresses, this can flaw the data • Many attacks must be known beforehand so that they can build responders • A new worm might be propagating heavily for the short period of time during their tests which would skew typically observed numbers • Heavier weights put on “more popular” attacks due to IP filtering, however “less popular” attacks may generate much more traffic
Contributions • Were able to quantify how much typical internet traffic is nonproductive • Were able to qualify this nonproductive traffic into categories and show much of it is malicious