Download
1 / 34
340 likes | 342 Views
This webinar outlines the description of the OTT ADC Acoustic Digital Current meter and presents the results of testing conducted by the USGS. It also highlights the new USGS firmware and enhancements. Learn about the meter's components, measuring principle, operation, depth sensor, QA/QC checks, and software enhancements.

E N D
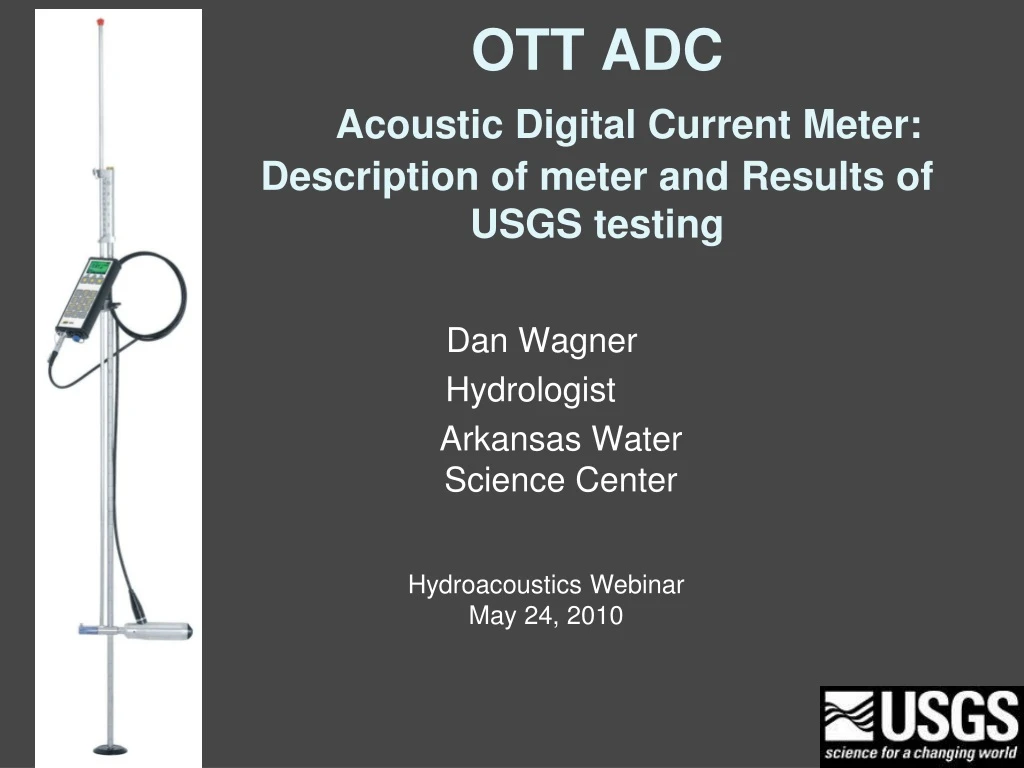
OTT ADCAcoustic Digital Current Meter: Description of meter and Results of USGS testing Dan Wagner Hydrologist Arkansas Water Science Center Hydroacoustics Webinar May 24, 2010
Outline • Description of ADC • Results of USGS Testing • New USGS Firmware / enhancements
ADC History • Released in USA December 2007 • Testing by HIF, HAWG, and WSCs from 2008-2010 • New USGS Firmware currently in Beta Testing
System Components Figure courtesy of OTT
Handheld Display Figure courtesy of OTT
Handheld Display Operation Figure courtesy of OTT
Display Screen Figure courtesy of OTT
Location of Sample Volume ADV ADC
4 in 2 in Sample volume 1 0.4 in Sample volume 2 Sensor head Measuring Principle • Two 6 MHz acoustic transducers • Large sample volume located in front of sensor • Large sample volume reduces potential signal-to- noise (SNR) issues, reduces error with flow angles • Two sample volumes • Improves data precision • Internal cross correlation calculation verifies measurement accuracy and identifies potential boundary issues Figure courtesy of OTT
Measuring Principle 1. Transmit – Receive - Digitize 3.93 in 1.97 in Break 0.4 in 2. Transmit – Receive - Digitize Cross Correlation Check for similarities Calculation of time shift Dt Calculation of flow velocity Slide courtesy of OTT
Depth Sensor • Calibrate by zeroing to atmospheric pressure on site (raise out of water to calibrate) • Get depth for each vertical by first lowering meter to bottom, rod offset computed automatically • Hand-held display shows target depth and actual depth for velocity measurement in vertical depending on the velocity method selected by the user. • Depth sensor can be turned off with new firmware
QA/QC Figure courtesy of OTT
QA/QC checks • With new USGS firmware, a Quick QA/QC check is performed in office (similar to ADV beam check, can print results) • Pre-measurement QA/QC check is logged with measurement file and appears on printout
Percent Difference of Velocity Measured with ADC Relative to Velocity Measured with ADV
ADC Pros/Cons-prior to USGS firmware Pros: Cons: Depth Sensor Sample volume in front of meter Rechargeable battery (?) Can’t edit erroneous stations until reviewing the measurement in Qreview Lack of beam check (“bucket test”) and/or quick field QA/QC check that is logged with measurement Lack of QA/QC warnings during measurement (i.e., for 0.2/0.8 velocity discrepancies, bad correlation resulting from bad boundary conditions • Depth Sensor • Sample volume in front of meter • Rugged Construction, cabling • Rechargeable battery • 2 beams-improved performance in environments with low SNR, angles • Live velocity reading-can help with meter placement
Software Enhancements • Enhanced quality assurance • Including pre-deployment quality check and field quality check • Ability to enter rated Q • Expanded character limits for station name and number and addition of measurement number • Computation and recording of averaged flow angles • On-screen warning messages, a.k.a., Measurement Guidance • Provide user with options to improve measurement results • Option to turn off depth sensor • Enhanced measurement review • Detailed discharge and quality check reports • Warning and potential quality issue logs • One-second time series data
New ADC QA/QC Warnings Figure courtesy of OTT