Download
1 / 28
280 likes | 387 Views
Using Fourier Domain Techniques to Characterize String Instruments, Nano-Scale Quantum Devices, and Human Brain Waves. Problems Addressed in Our Researches :. How can we characterize the quality of a string instrument independent of human subjectivity?

E N D
Using Fourier Domain Techniques to Characterize String Instruments, Nano-Scale Quantum Devices, and Human Brain Waves
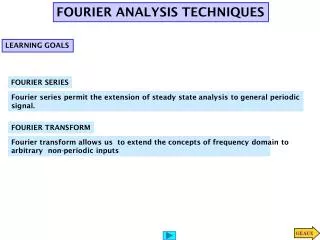
Problems Addressed in Our Researches: • How can we characterize the quality of a string instrument independent of human subjectivity? • How can we evaluate the quality of a quantum cascade laser wafer prior to the fabrication and testing processes? • How can we typify the mental health of psychiatric patients by looking at brain waves? • How can Fourier Analysis simplify the evaluation process and help to extract key features from all the above signals? • How can these seemingly unconnected subject areas be correlated through Fourier Analysis?
Fourier Transform (Time Frequency or Spatial K ) x(t) X(f)
Fourier Transform T1 f=2/T1 T2 2f=2/T2 f and 2f FREQUENCY DOMAIN TIME DOMAIN Amplitude Amplitude Amplitude Amplitude Amplitude Amplitude
Fourier Analysis Inverse Fourier transform is converting frequency domain signals into time domain signals – a time domain signal can be synthesized by adding together different frequency components. Individual harmonics in the frequency domain can be selectively added together to synthesize a time domain signal. X(f) x(t)
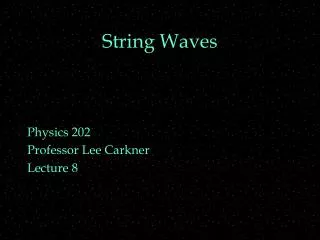
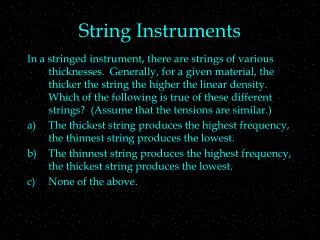
Applications to String Instruments: • Using Fourier Analysis to evaluate the quality of string instruments • Time domain signals -> Frequency domain spectra • Analyze both static and dynamic spectra (vibrato efficiency) • Ref:“Real time spectrum analyzer analysis and evaluation of string instruments”, Acoustic Research Institute, The 16th International Congress on Sound and Vibration, Kraków, Poland, 5-9 July 2009.
Introduction- Modes • Fundamental Frequency: longest wave in a family of standing waves determined by the string length and resonates with the cavity; the original pitch. • Higher (Nth) Harmonic: has a frequency that is an integer multiple (N) of the fundamental pitch (and with a wavelength N times shorter than the of the fundamental) The degree to which the harmonics are expressed depends on the instrument material and pattern (Chladni patterns for violins).
Static Spectra Comparison of Different Violins G-string X-axis in unit of (Hertz), Y-axis in unit of (dB) • What to look for: • Presence of harmonics – no missing harmonics • Number of harmonics – the more the better • Narrow peaks – no extra noise • Spectrum of one note at one instance – a whole family of harmonics is shown Higher Price >$18,000 Lower Price <$2,000
Extracting Statistic Data From Dynamic Spectra Tektronix Real Time Spectrum Analyzer RSA 3000 "Vibrato" - changing string’s total oscillation length MATLAB: extract data and analyze statistic parameters Single frame spectrum at one specific time Dynamic spectrum >100 frames along the time axis Center frequency traces: Standard deviation Flow chart of the experiments.
Frame 0 Frame 1 In Frame -1 All harmonic peaks Shifted to higher frequency compared with frame 0 Total >50 frames here 9 frames here First 3 of the 9 frames Frame -2 Frame -1 Frame 0
Statistical Data of Frequency Modulated Harmonic Peaks(Oscillating up and down in Unit of Hz) (a) (b) (a) (b) Single tone data generated from (a) a less expensive violin and (b) a higher price violin. Bottom red numbers are the Standard Deviations of their data above – The higher price violin apparently has a higher FM efficiency
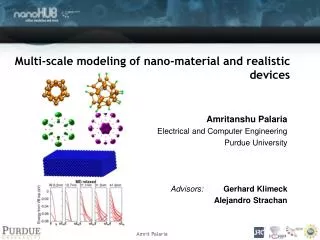
Applications to Nano-Scale Quantum Devices (Quantum Cascade Lasers) • Use Fourier Analysis to evaluate quality of grown laser materials (very useful to manufacturers) • Spatial Domain Structure -> k(angle) -domain x-ray spectra • Correlate x-ray diffraction patterns to various growth problems – understand what has happened during growths, decide whether to proceed on to fabrication • Ref: 1. ”Evaluation of nano-scale quantum devices using x-ray diffraction and Fourier analysis”, Material Research Society Spring Meeting, Paper HH8.3, San Francisco, CA, April 13 – 17, 2009. 2. “X-ray diffraction analysis of quantum cascade lasers”, IEEE, LEOS, The 21st International Conference on Indium Phosphide and Related Materials, paper WP2, Newport Beach, CA, May 10 – 14, 2009.
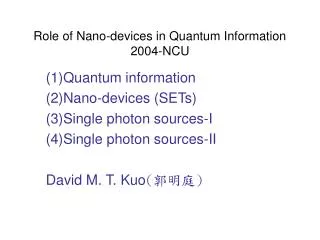
Quantum Cascade Laser Applications Gas sensing and chemical detection for chemical industry, health, environmental Infrared counter measure See-through Imaging for homeland security and health Breath Analysis – Portable (equivalent) blood testing, Drug dynamics study
QCL Processing and Characterization Cleanroom Fabrication Testing Crystal Growth Light vs. current Current vs. voltage Fabrication X-Ray Scan Photoluminescence Measurement (PL) Packaging X-Ray PL Compare X-ray, PL, data with final laser L-I, I-V results – Identify design and growth problems
Quantum Cascade Lasers: X-Ray Analysis and Bragg Diffraction 2dsin()=n n : an integer Constructive interference at a particular angle d k1(1) k2(2) k3(3) With different diffraction angles. Diffraction Madmax Bragg diffraction is a Fourier Transformation from the spatial domain to the k domain (represented by angles) • Can be used to monitor the growth results of Quantum Cascade Lasers (QCLs) • The gradual change in the superlattice period can be seen in the Fourier domain as a reduction of the convolution length. • The degradation of the superlattice periodicity will affect the line-shape, width, and height of satellite peaks in a x-ray scan diffraction pattern.
Straining and Hetero-Interface Defects Compressive Straining: ~ Indium Rich– In atoms are larger than Ga or Al ones ~ grown material has larger lattice constant than that of the wafer material ~ lattice mismatch between the wafer and substrate ~peaks shift left Tensile Straining: ~the opposite of compressive straining ~ grown material has a smaller lattice constant than that of wafer material ~peaks shift right Blue Arrow = hetero-interface defects
Change in Growth Rate Double Peaks wafer growth rate changes suddenly, resulting in two different lattice constants Double Peak simulation using Bede By suddenly changing to a 2nd growth rate
Chirping X-ray spectra of a high-power room temperature CW QCLs (blue) and X-ray scans from the same layer structure but with dramatically worse device performance (red). Chirping = gradually changing chemical composition; asymmetric satellite peaks
(c) (a) (b) (d) Relaxation in Strain Balanced Superlattices: • Strain Balanced: Superlattice layers alternately compressed and tensile strained. Overall strain is balanced - the average lattice constant close to the substrate lattice constant. • Relaxation: Occurs in the thicker layers - layers are strained too much, chemical bonds between atoms begin to break, degrading the periodicity. Fig. 1 (a) Simulated layer relaxation with around 0.3 % relaxation in some of the thicker InGaAs layers – note how peaks tilt upwards from left to right (b) 0.3 % relaxation in some of the thicker InAlAs layers – note how peaks tilt downwards from left to right. (c) experimental results of a seriously relaxed superlattice material. (d) Simulation - .2% relaxation in some of the thicker InAlAs layers 19 19
Table of QCL Performance Degradations: No chirping Parameters for evaluating QCL performance: Threshold = the lower the better Temperature Range = the larger the better P max = the greater the better, best is to achieve continuous wave (CW)
Applications to Human Brain Waves • Use Fourier Transform to evaluate the health of human brain waves • Signals are less periodic (compared with music signals and superlattice structures) and more noisy (needs averaging and filtering). • Comparison of brainwaves of psychiatric patients to typical brainwaves • Is the gating effect observed? • Publication for new results (new gating effect at Fourier domain) is in preparation.
All data is averaged and extra noise not due to waves not synchronized with the two audio clicks are removed. Audio stimulation signals 1 2 1 2 500ms Human Brain Waves Setup: • EEG patterns measured for both normal people and psychological patients • Comparison of excitement from first stimulus with excitement from second stimulus for various brain wave rhythms. • Observation of the brain’s gating effect: is there suppression of response to repeated audio stimuli? • Time domain EEG waves must be Fourier transformed into the frequency domain in order to compare power graphs for normal vs. abnormal brain functioning.
Time domain Time domain Frequency domain Frequency domain Human Brain Wave: Fourier Domain Comparison Graphs Blue-1, Red-2 Control Patient
Discussion and Conclusions: For less periodic and noisy signals like brain waves, Fourier analysis is still helpful to identify patients from normal people. Our new study results (publishable) clearly show that the patient’s frequency peaks of the two auditory responses are shift instead of aligned (normal).
Acknowledgements: • Professor Jacob Khurgin, the Johns Hopkins University, Department of Electrical and Computer Engineering • QCL Crystal Growers: Dr. Jiaxing. Chen - Princeton University, Mr. Liwei Cheng - UMBC, Dr. Xiaojun Wang – Adtech Optics Inc. • Dr. Elliot Hong, Maryland Psychiatric Research Center, UMAB
Laser Growth Problems – Interpreted with Madmax and Bede Ray Simulations Indium Rich– In atoms are larger than Ga or Al ones, so lattice constant increases, resulting in lattice mismatch between the wafer and superlattice; compressive straining shown in red Blue Arrow = hetero-interface defects Double Peaks –wafer growth rate changes suddenly – resulting in two different lattice constants Double Peak simulation using Bede Rays Chirping = gradually changing chemical composition; asymmetric satellite peaks X-ray spectra of a high-power room temperature CW QCLs (blue) and X-ray scans from the same layer structure but with dramatically worse device performance (red).