Download

1 / 40
700 likes | 2.41k Views
SPECIES RICHNESS. READINGS: FREEMAN, 2005 Chapter 54 Pages 1265-1277. CONSERVATION BIOLOGY. Conservation biology is a new science that has developed in response to concerns about decreasing biodiversity.

E N D
SPECIES RICHNESS READINGS:FREEMAN, 2005 Chapter 54Pages 1265-1277
CONSERVATION BIOLOGY • Conservation biology is a new science that has developed in response to concerns about decreasing biodiversity. • It seeks to understand the effects of human activities on populations, species, communities and ecosystems. • It intends to develop practical approaches to preventing declines in biodiversity and to restore species into functioning ecosystems.
What is Biodiversity? • Biodiversity is the full range of living things on earth and their surroundings and their heritage (genes). • “Everything from genes to ecosystems” • The millions of plants, animals, fungi and microbes that inhabit earth; the genes they contain; and the ecosystems they help build.
Biodiversity Is Reflected In: • Ecosystem (Community) Diversity as described by community composition and environmental conditions. • Species Diversity as measured by species richness (number of species) and relative abundance of each species (species evenness). • Genetic (Populational) Diversity as determined by morphological traits and DNA comparisons.
ECOSYSTEM DIVERSITY The diversity of life within the biosphere can be seen at global, regional and local scales: • Biomes (Global) -- marine, freshwater, terrestrial; • Life Zones (Regional) -- marine [littoral (shore), pelagic (open water), benthic (bottom), abyssal (dark), reef (shallow)]; • Habitats (Local) -- prairie [wet, mesic, dry].
ECOSYSTEM DIVERSITY • Preserved as National Parks. • Natural areas owned by the Federal Government. • Preserved for scientific, educational and recreational activities. • Showcases of nature including a wide spectrum of ecosystems.
GENETIC DIVERSITY The diversity of life is fundamentally genetic. A variety of genetic methods have been used to investigate diversity both within and between species. Here are a few: • Morphological variation -- a good clue, but does not correlate perfectly with genetics; • Chromosomal variation -- inversions, translocations and polyploidy; • Soluble proteins -- blood groups, soluble enzyme polymorphism’s; • DNA markers -- microsatellites, “fingerprint” loci.
Morphological Variation • Morphology (appearance or phenotype) provides clues to the genetic diversity that underlies species differences. • But, ‘looks can be deceiving. The wolf and coyote show distinct mussel lengths. The red wolf is in fact a hybrid between these two species; thus, has an intermediate mussel length
Chromosomal Variation • This ideogram (arrangement of chromosome photos) shows variation in genetic material from a species of Brazillian fish species. • This is a striking example of genetic variation within a morphological species.
Soluble Protein Variation • The human ABO blood groups are an example of soluble proteins that demonstrate genetic variation. • Prior to DNA technology, soluble proteins provided some of the first material for studying heterozygosity, a measure of genetic variation.
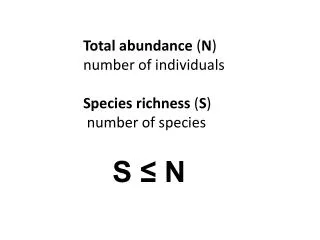
SPECIES DIVERSITY • Species Richness is a measure of the total number of species in an area or taxonomic group. A simple count of number of species. • Species Evenness is a measure that indicates how evenly the total number (abundance) of individuals is apportioned among species. The Simpson Index and Shannon-Weaver Index are measures of evenness. • Species Difference (Taxonomic Diversity) is a measure of phenotypic differences among species. A rough over-view of this concept is seen in classification schemes.
SPECIES DIFFERENCE (TAXONOMIC DIVERSITY) • Classification system of Domains, Kingdoms, Phyla or Divisions, Classes, Orders, Families, Genera, Species. • Two Domains - Prokaryotes & Eukaryotes. • Six Kingdoms - Archaebacteria, Eubacteria, Protista, Plantae, Fungi, Animalia.
SPECIES RICHNESS • How many species on earth? • Only 1.5 million have been classified. • Best estimate places number of species at 10 million. • Birds, mammals and butterflies are mostly named and described by science.
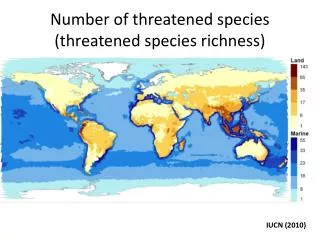
Global Distribution of Species Richness • Highest species richness is found in tropical forests. • Mammals and butterflies are often used as indicators of species richness. • Endemic species is found only in the local or regional area. Numbers for Richness (Endemic).
SPECIES EVENNESS • The Simpson Index (or Diversity Index) gives a simple measure of evenness. • It addresses the question: What is the probability that two individuals encountered at random in a community will belong to the same species? • D = 1 - sum(pi)2 where D is the Diversity Index with values that vary from 0 (all of same species) to 1 (myriads of species, all equal in number); sum over all species in community; pi is the proportion of species i in the community.
Simpson Index (or Diversity Index) • For example, consider two communities (1 and 2), each of which has 3 species, A, B and C.
Simpson Index (or Diversity Index) D = 1 - sum(pi)2 = 1 - [(0.98)2 + (0.01)2 + (0.01)2 = 1 - (0.96) = 0.04 Community 1 has very low species evenness.
Simpson Index (or Diversity Index) D = 1 - sum(pi)2 = 1 - [(0.35)2 + (0.32)2 + (0.33)2 = 1 - (0.33) = 0.66 Community 2 has very high species evenness.
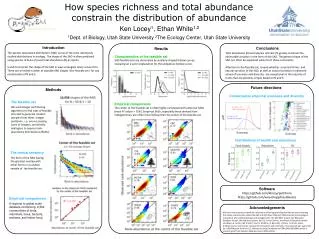
Diversity Increases Productivity (I) • Hypothesis: More species result in higher community productivity. • Method: Plots with the same number of plants, but with different numbers of species were created. In the second year of growth, the area of each plot covered by plants was measured.
Diversity Increases Productivity (II) • Results: Communities with higher species richness had a higher percentage of the area covered by plants. See Figures 53.24 and 55.4 in Freeman (2005) for description of the experiment (page 1238) and definition of functional groups (page 1271-1272). • Conclusion: Diverse communities are more productive.
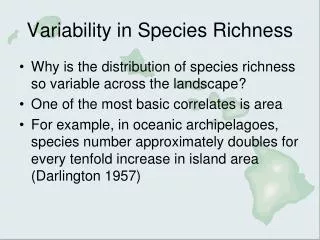
Biogeography and Species Richness • Number of species on an island is related to its size. • In general, a 10 fold larger area will have twice the number of species in a given taxa. • Conservation biologists have used this generalization to predict species loss from habitat destruction and to determine optimum preserve size.
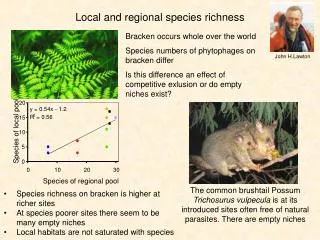
Species-Area Relationships • The observation that the number of species in a sample plot increases as a log-log function of area is well established. • This graph indicated data for native species from 104 sites throughout the world. (Lonsdale, 1999)
Species-Area Relationships • To learn more about species-area relationships see the laboratory on Biodiversity and Nitrogen Deposition. • Also, read section 53.3 on pages 1236-1239 and 1275-1276 in Freeman (2005).
Species Loss in Local Communities • Recensus of 54 Wisconsin Prairies showed 8-60% loss of native plant species after 32-52 years. Local extinction at a rate of 0.5-1.0% per year. • Annual rate of loss elsewhere: Limestone out crop in England (1.6%); Beech-Hemlock forest in Pennsylvania (0.9-1.2%); Calcareous grassland in Czech Republic (1.1%); Seeps in California (1.6%).
Declining Eastern U.S. Songbird Populations • Migratory populations of most songbird species declined substantially sing the 1940’s; those hardest hit are scarlet tanager, wood thrush, American redstart. • Even some resident populations have declined; song sparrow, white-breasted nuthatch. • Others are stable; northern cardinal, Carolina chickadee.
Causes of Decline in Native Populations of Plants and Animals • Habit Destruction: Conversion of natural areas into farms, dwellings, industries, places of business and corridors for transportation. • Introduction of Exotic (Non-native) Plants and Animals: The intentional or unintentional transport of a plant, animal, fungal, protozoan or bacterial species into areas where they did not previously occur. • Overexploitation: Hunting, fishing, grazing, cutting, gathering, collecting native plants and animals. • Other: Pollution (particularly aquatic species); Unknown. • Decline is often due to a combination of the above causes, as well as demographic and other environmental factors.
Major Causes of Endangerment Of 632 species listed as endangered in the 50 states, the major causes of endangerment were:
HABITAT DISTRUCTION • Habitat loss and fragmentation are the most pervasive threats to the conservation of biodiversity. • Farming and logging prior to the 1900’s were responsible for most habitat loss in eastern U.S. • Residential and commercial development are the primary reasons for habitat loss in recent times.
Loss of Forest Habitat • The rate of loss of deciduous forest habitat between the 1850’s and early 1900’s is more than 10 times faster than after. • In fact, today forest acreage is increasing due to abandonment of farmland. 1620 1850 1920
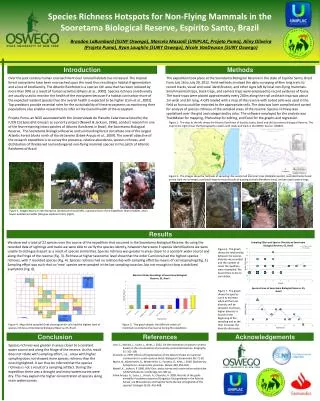
Edge Effects in Fragmented Forests • Biologists recorded forest fragmentation by following the fate of 66 study plots in Manaus, Brazil. There were four 1-hectare fragments, 3 10-hectare fragments and 2 100-hectare fragments. • The graphed results indicate a decline in biomass in 16 study plots along forest edges. • The loss of large trees along edges reduced the number of habitat layers; thus, beetles, orchids and birds disappeared. • See Freeman (2005) Figure 55.7 for more.
EXOTIC SPECIES • Exotic or invasive species are non-native plants and animals introduced into an area by people. • They are able to establish populations in the wild. • They lack natural predators, competitors or pathogens in the new place. • They often have “boom and bust” population dynamics. • Currently more than 4,500 exotic species in U.S. • They are arriving at a high rate due to accelerated trade and travel.
Examples of Introduced (Exotic) Animal Species • Flathead catfish -- Introduced as a “sport” fish into rivers of the SE and SW US from the Midwest US. • Asian Longhorn Beetle -- Arriving from China on shipping pallets into New York City and Chicago. • Cherry Bark Tortrix -- arriving from Asia via Europe into ports in Washington state , currently spreading into Oregon.
Examples of Introduced (Exotic) Plant Species • Purple Loostrife -- Introduced from Europe as a horticultural plant. • Tamerix -- Newly established in SW US desert as an escaped ornamental introduced from Eurasia. • Old-World Climbing Fern -- A nursery escape in Florida from SE Asia.
Introduction of Zebra Mussel • The geographical distribution of the zebra mussel is being extended rapidly in the US. • First reported in the St. Lawrence Seaway on 21 November of 1991 it had spread throughout the Missouri and Mississippi drainage basin by the year 2000.
OVERHARVESTING OF WHALES • The whaling industry engaged in harvesting almost to the point of extinction of some species. • End of commercial harvest -- Blue Whale 1969; Fin Whale 1975; Sei Whale 1977; Sperm Whale 1982. • International ban on whaling. • Resumption of harvest will call for a sustained yield harvest.
OVERHARVESTING OF GINSENG • Ginseng is used as a herbal by people throughout the world. • Harvesting natural populations in eastern U.S. has endangered this deciduous forest plant.
SPECIES RICHNESS READINGS:FREEMAN, 2005 Chapter 54Pages 1265-1277