Download

1 / 89
920 likes | 1.42k Views
Chapter 2 The Global Economic Environment. Review of Chapter 1. What is Global Marketing? How is it different from regular marketing?. Reasons for Global Marketing. Growth Access to new markets Access to resources Survival

E N D
Review of Chapter 1 • What is Global Marketing? • How is it different from regular marketing?
Reasons for Global Marketing • Growth • Access to new markets • Access to resources • Survival • Against competitors with lower costs (due to increased access to resources)
Global Marketing: What it is and What it isn’t • Strategy development comes down to two main issues similar to single country marketing • Target market • Marketing Mix
The Importance of Global Marketing • For US-based companies, 75% of sales potential is outside the US. • About 90% of Coca-Cola’s operating income is generated outside the US. • For Japanese companies, 85% of potential is outside Japan. • For German and EU companies, 94% of potential is outside Germany.
Standardization versus Adaptation • Globalization (Standardization) • Developing standardized products marketed worldwide with a standardized marketing mix • Essence of mass marketing • Global localization (Adaptation) • Mixing standardization and customization in a way that minimizes costs while maximizing satisfaction • Essence of segmentation • Think globally, act locally
Management Orientations Ethnocentric: Home country is Superior, sees Similarities in foreign Countries Polycentric: Each host country Is Unique, sees differences In foreign countries Regiocentric: Sees similarities and differences in a world Region; is ethnocentric or polycentric in its view of the rest of the world Geocentric: World view, sees Similarities and Differences in home And host countries
Driving Forces Regional economic agreements Market needs and wants Technology Transportation and communication improvements Product development costs Quality World economic trends Leverage Restraining Forces Management myopia Organizational culture National controls Forces Affecting Global Integration and Global Marketing
Introduction to Chapter 2 • Market definition – People or organizations with needs and wants; both have the willingness and ability to buy or sell • The global economic environment plays a large role in the development of new markets for organizations
Turkish Trading Partners (2005) • Germany 13%, • UK 8.2%, • Italy 7%, • US 6.9%, • France 5.1%, • Spain 4.2%
Source: World Bank (2006)
Gini coefficient • The Gini coefficient is a measure of statistical dispersion most prominently used as a measure of inequality of income distribution or inequality of wealth distribution. It is defined as a ratio with values between 0 and 1: A low Gini coefficient indicates more equal income or wealth distribution, while a high Gini coefficient indicates more unequal distribution. 0 corresponds to perfect equality (everyone having exactly the same income) and 1 corresponds to perfect inequality (where one person has all the income, while everyone else has zero income). The Gini coefficient requires that no one have a negative net income or wealth. Worldwide, Gini coefficients range from approximately 0.232 in Denmark to 0.707 in Namibia although not every country has been assessed. • The Gini index is the Gini coefficient expressed as a percentage. Thus Denmark's Gini index is 23.2%.
Human Development Index • The Human Development Index (HDI) is an index combining normalized measures of life expectancy, literacy, educational attainment, and GDP per capita for countries worldwide. It is claimed as a standard means of measuring human development—a concept that, according to the United Nations Development Program (UNDP), refers to the process of widening the options of persons, giving them greater opportunities for education, health care, income, employment, etc. The basic use of HDI is to rank countries by level of "human development", which usually also implies to determine whether a country is a developed, developing, or underdeveloped country.
Human Development Index 2008 update
U.S. Multinational in Europe - 1960’s Fifteen years from now the world’s third greatest industrial power, just after the United States and Russia, may not be Europe, but American industry in Europe. 2-3 J.S. Servan Schreiber: Le Defi American, 1967 What Happened?
The Nationality of the World’s 100 Largest Industrial Corporations (by country of origin) 1963 1979 1984 1990 1993 1995 1996 2000 United States 67 47 47 33 32 24 24 36 Germany 13 13 8 12 14 14 13 12 Britain 7 7 5 6 4 1 2 5 France 4 11 5 10 6 12 13 11 Japan 3 7 12 18 23 37 29 22 Italy 2 3 3 4 4 3 4 3 Netherlands-United Kingdom 2 2 2 2 2 2 2 -- Netherlands 1 3 1 1 1 2 2 5 Switzerland 1 1 2 3 3 3 5 3 Argentina -- -- 1 -- -- -- -- -- Belgium -- 1 1 -- -- -- -- 1 Brazil -- 1 -- 1 1 -- -- -- Canada -- 2 3 -- -- -- -- -- India -- -- 1 -- -- -- -- -- Kuwait -- -- 1 -- -- -- -- -- Mexico -- 1 1 1 1 -- 1 -- Venezuela -- 1 1 1 1 -- 1 -- South Korea -- -- 4 2 4 2 4 -- Sweden -- -- 1 2 1 -- -- -- South Africa -- -- 1 1 -- -- -- -- Spain -- -- -- 2 2 -- -- -- Turkey -- -- -- -- 1 -- -- -- China -- -- -- -- -- -- -- 2 2-4
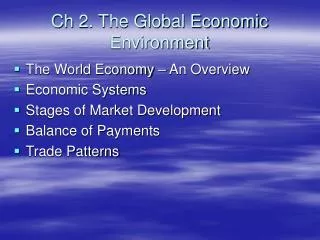
The World Economy – An Overview • The new realities: • Capital movements have replaced trade as the driving force of the world economy • Production has become uncoupled from employment • The world economy, not individual countries, is the dominating factor
The World Economy – An Overview • The new realities continued: • 75-year struggle between capitalism and socialism has almost ended • E-Commerce diminishes the importance of national barriers and forces companies to re-evaluate business models
Economic Systems • 4 main types of economic systems • Market Capitalism • Centrally planned socialism • Centrally planned capitalism • Market socialism
Economic Systems Resource Allocation Market Command Centrally Planned Capitalism Private Resource Ownership State Market Capitalism Centrally Planned Socialism Market Socialism
Economic Freedom • Rankings of economic freedom among countries • Ranges from “free” to “repressed” • Variables considered include such things as: • Trade policy • Taxation policy • Banking policy • Wage and price controls • Property rights
Free Hong Kong Singapore Ireland New Zealand United States United Kingdom Netherlands Australia Switzerland Repressed Bosnia Vietnam Laos Iran Cuba Iraq Libya North Korea Congo Economic Freedom
Buying Boom for Asia, 1995-2000 What the added Between 1993 and middle class will 1995 2000 buy (In million) 73.3 Millions of households approaching $18,000 per year buying power Indexed to Singapore prices Bedrooms 32 116 Living Rooms 16 58 Kitchens 16 58 Bathrooms 32 116 Living space (sq.m.) 1,200 4,350 Large appliances 16 58 Televisions 24 87 Telephones 24 87 Cars 16 58 32.5 14.4 1991 1995 2000 SOURCE: Bill Saporito, “Where the Global Action Is.” Fortune, Autumn-Winter 1993, p.64.
What Would One U.S. Dollar Buy? (Selected Years) 1985 1987 1988 1992 1993 1994 1995 1996 1997 1999 2000 British Pound 0.86 0.67 0.54 0.56 0.66 0.68 0.63 0.64 0.59 0.62 0.68 French Franc 9.6 7.55 5.4 5.29 5.67 5.55 4.95 5.12 5.94 6.49 7.28 Japanese Yen 250.23 123.32 123.70 126.70 111.08 102.18 93.96 108.78 129.15 102.58 112.21 Swiss Franc 2.25 2.07 1.29 1.41 1.48 1.37 1.18 1.24 1.43 1.58 1.68 EURO 0.99 1.11 Mexico Peso 0.37 2.21 2.28 3.12 3.11 5.31 6.45 7.60 7.92 9.43 9.47 * Foreign Exchange Rates for 1999 and 2000 are the average rate pf exchange in December. Source: Adapted from www.stat-usa.gov
The Price of Protectionism Industry Total Costs to Number of Cost per Consumers Jobs Saved Job Saved (in $ millions) Textiles and apparel $27,000 640,000 $ 42,000 Carbon Steel 6,800 9,000 $ 750,000 Autos 5,800 55,000 $ 105,000 Dairy products 5,500 25,000 $ 220,000 Shipping 3,000 11,000 $ 270,000 Meat 1,800 11,000 $ 160,000 SOURCE: Michael McFadden, “Protectionism Can’t Protect Jobs,” Fortune, May11, 1987, pp. 125.
Big Emerging Markets • China • India • Indonesia • South Korea • Brazil • Mexico • Argentina • South Africa • Poland • Turkey ██ Emerging markets██ Developed markets
Rapidly Developing Economies • The term "rapidly developing economies" is now being used to denote emerging markets such as • The United Arab Emirates, • Chile and • Malaysia • that are undergoing rapid growth.
Stages of Market Development • World Bank has defined four categories of development • High-income countries • Upper-middle income countries • Lower-middle income countries • Low-income countries • Based upon Gross National Product (GNP)
Marketing Opportunities in LDCs • Characterized by a shortage of goods and services • Long-term opportunities must be nurtured in these countries • Look beyond per capita GNP • Consider the LDCs collectively rather than individually • Consider first mover advantage • Set realistic Deadlines
Turkey Return
Influencing the World Economy • Group of Seven (G-7) • Organization for Economic Cooperation and Development • The Triad
The Triad: Trade Between the United States and Canada, the European Community, and Japan, 1997 ($ billions) EUROPEAN COMMUNITY 31.4 97.1 110.9 68.8 JAPAN UNITED STATES & CANADA 52.7 99.5 For additional figures see: “Indicators of Market Size for 115 Countries I” Crossborder Monitor, August, 1994, pp.4-7
N-11 • The Next Eleven (or N-11) is a short list of countries named by Goldman Sachsinvestment bank on 1 December 2005 as having promising outlooks for investment and future growth.
BRIC • BRIC or BRICs are terms used to refer to the combination of Brazil, Russia, India, and China. • The economies of the BRICs are rapidly developing and by the year 2050 will eclipse most of the current richest countries of the world.
BRICET • "BRIMC" (M for Mexico), • "BRICS" (S for South Africa) • "BRICET" (including Eastern Europe and Turkey) have become more generic marketing terms to refer to these emerging markets.
Market Characteristics • Population demographics - Age distribution, life expectancy, household size, urbanisation • Income - Low, Medium and High - GDP per capita - Purchasing Power Parity (PPP) • Consumption Patterns - Income spent on necessities and luxuries - Product saturation and diffusion - Product form differences
Market Characteristics Availability and quality of infrastructure - Distribution networks (road, rail) - Communication systems for marketing - Supply and use of energy Foreign involvement in the economy - Degree of FDI (foreign direct investments) and the industries - Investment rules and guidelines Impact of economic environment on social development - urbanisation, life expectancy, literary rates, physical quality of life index (PQLI)