Download
1 / 43
430 likes | 565 Views
Working with K-12 Students to Create a Statistics Poster . John Gabrosek and Neal Rogness Grand Valley State University ASA Meeting Within a Meeting Webinar December 3, 2007. A BRIEF HISTORY OF THE ASA - NCTM STATISTICS POSTER COMPETITION.

E N D
Working with K-12 Students to Create a Statistics Poster John Gabrosek and Neal Rogness Grand Valley State University ASA Meeting Within a Meeting Webinar December 3, 2007
A BRIEF HISTORY OF THE ASA - NCTM STATISTICS POSTER COMPETITION • The first national poster competition held in spring 1990 was a joint effort between the ASA Center for Statistics Education and the ASA Section on Statistical Graphics. • In the mid-1990s the ASA and NCTM assumed responsibility for the poster competition through the ASA/NCTM Joint Committee. • The national competition spawned numerous regional and statewide competitions. • Statisticians at Grand Valley State University (GVSU) have organized a competition open to all kindergarten through grade 12 students in the state of Michigan since 2000. (background from Young 1998 and Rogness et. al 2003).
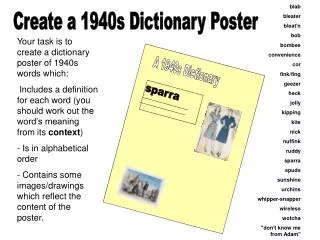
WHAT IS A STATISTICS POSTER • A statistics poster is a visual display that uses one or more related graphs to summarize data, discuss different points of view, answer question(s) about and explore data.
EDUCATIONAL GOALS OF A STATISTICS POSTER COMPETITION – ASA MISSION STATEMENT The ASA Mission Statement states that ASA should • “work for the improvement of statistical education at all levels.” • “promote the proper application of statistics.” ASA members are encouraged to use their expertise for • “the promotion and development of statistical education for the public and the profession.” (http://www.amstat.org/)
EDUCATIONAL GOALS OF A STATISTICS POSTER COMPETITION • The NCTM Standards set out a comprehensive vision for mathematics instruction of students from pre-kindergarten (age 4) through grade 12 (age 18). • Included in the NCTM standards are content area expectations related to statistics and probability. (http://standards.nctm.org/)
NCTM STANDARDS • The Data Analysis and Probability Standard indicates that students should be able to “formulate questions that can be addressed with data and collect, organize, and display relevant data to answer them.”
NCTM STANDARDS • The Data Analysis and Probability Standard indicates that students should be able to “formulate questions that can be addressed with data and collect, organize, and display relevant data to answer them.” K-3: “Have the number of hurricanes that have hit the United States increased or decreased in the past 154 years?” “Data was collected from the United States National Hurricane Center website…”
NCTM STANDARDS • The Data Analysis and Probability Standard indicates that students should be able to “formulate questions that can be addressed with data and collect, organize, and display relevant data to answer them.” K-3: “What hand should you use if you have to put beans in a cup?” “We gathered data from a girls club at church… They had 15 seconds to put beans in a cup… They did this twice, first with the dominant hand, then with the other hand.”
NCTM STANDARDS • The Data Analysis and Probability Standard indicates that students should be able to “formulate questions that can be addressed with data and collect, organize, and display relevant data to answer them.” 10-12: “Can people tell what type of water (bottled or tap) they chose (as best tasting)?” “We assigned 60 subjects...to two different groups. The first group had sample 1 as tap water and sample 2 as bottled water. The second group had sample 1 as bottled water and sample 2 as tap water. ”
NCTM STANDARDS • The Communication Standard specifies that students should be able to (1) organize and consolidate their mathematical thinking through communication, (2) communicate their mathematical thinking coherently and clearly to peers, teachers, and others, and (3) use the language of mathematics to express mathematical ideas precisely.
NCTM STANDARDS • The Communication Standard specifies that students should be able to (1) organize and consolidate their mathematical thinking through communication, (2) communicate their mathematical thinking coherently and clearly to peers, teachers, and others, and (3) use the language of mathematics to express mathematical ideas precisely. 7-9: “This research is designed to explore what kinds of stuffed animals children of different ages and sexes play with.”
7-9: “The length and age histogram shows the distribution of lengths of animals. If there was a relationship between age and animal length, the histogram would have shown more yellow toward the longer (right side) animals and more red toward the shorter (left side) animals. This was not the case.”
NCTM STANDARDS • The Representation Standard requires that students be able to “create and use representations to organize, record, and to communicate mathematical ideas.”
NCTM STANDARDS • The Representation Standard requires that students be able to “create and use representations to organize, record, and to communicate mathematical ideas.” K-3: “What hand should you use if you have to put beans in a cup?”
K-3: “The dominant hand DID put more beans in the cup, on average just like WE guessed.”
NCTM STANDARDS • The Measurement Standard involves gaining an understanding of measurable attributes of objects.
NCTM STANDARDS • The Measurement Standard involves gaining an understanding of measurable attributes of objects. K-3: “I wanted to know how to round and learn about categories… In math I learned how to measure in centimeters and wanted to practice it. I have just learned how to round to 10 and chose that as my category.”
K-3: “I am john and I am doing a study about the stuffed animals of our family. We have lots of stuffed animals and they are hard to put away. Mom thinks we don’t have too many but I think we do.”
State Mathematics Standards • Check the state mathematics standards for your own state • No doubt, participation in the Poster Competition will allow you to meet some of your own state standards as well as the NCTM Standards
Utah State Mathematics Standards • Third Grade Mathematics Standard V • Students will collect and organize data to make predictions and identify basic concepts of probability. • Fourth Grade Mathematics Standard V • Students will interpret and organize collected data to make predictions, answer questions, and describe basic concepts of probability. • Fifth Grade Mathematics Standard V • Students will construct, analyze, and construct reasonable conclusions from data and apply basic concepts of probability. • Sixth Grade Mathematics Standard V • Students will analyze, draw conclusions, and make predictions based upon data and apply basic concepts of probability. • Math 7 Standard V • Students will understand concepts from probability and statistics and apply methods to solve problems.
HOW-TO CREATE A STATISTICS POSTER • Selecting a topic • Determining how to display data graphically • Communicating your message
SELECTING A TOPIC • Brainstorm a list of possible topics as a class or in groups of up to 4 students Be free-thinking Do not rush to critique any ideas Brainstorm sources for ideas – think about national, state, regional, local, school issues
SELECTING A TOPIC • Critique the ideas as a class or within groups If an idea is too broad encourage students to narrow it down Discuss the interest of the topic to the students and to others inside and outside the class
SELECTING A TOPIC • Consider how to collect data on the chosen topic Discuss the population of interest & sampling concerns • When the study is done, who or what is it you want to be able to say something about? • If data are being collected from individuals, how will these persons be selected fairly so they represent the population of interest? Discuss whether data will be obtained from a survey, an experiment, the Internet, from the library, etc. Discuss challenges with data collection • Survey questions must be clear – pilot survey • Experiments must be doable and repeatable – keep them simple • Data must be obtainable to answer the question of interest
DATA COLLECTION Baseball - This broad category must be narrowed down. For example, students could compare the number of home runs hit by the home run champions over the past 40 years in the American and National Leagues. Separate graphs for each league would allow comparison between the two leagues. Television - A student can take a poll of students at his school. He can ask each student "What is your favorite type of TV show – comedy, drama, sports, etc.” If the student also records the student’s gender (or grade), the student can give separate bar charts for comparison.
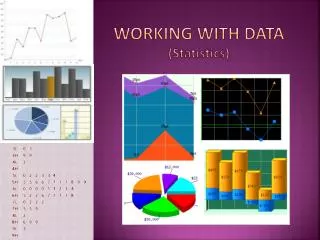
DISPLAYING DATA GRAPHICALLY • Goal of graphs The reader of your poster should be able to look at the graphs and understand the story of the data. It may be useful to think of graphs as photos that make it easy for your reader to visualize all of the information that you have collected.
DISPLAYING DATA GRAPHICALLY • Data types Qualitative – data fall into categories or labels, such as the league a homerun champion plays in Quantitative – data are meaningful numbers discrete – generally counts, such as the number of homeruns hit by the league champion continuous – generally measurements, such as the weight of the homerun hitting champion
DISPLAYING DATA GRAPHICALLY • Graph Selection Qualitative or Discrete – bar graphs, pie charts
DISPLAYING DATA GRAPHICALLY • Graph Selection Continuous – histogram, stem-leaf plot, boxplot
COMMUNICATING YOUR MESSAGE • Make sure everything on the poster is correct • There should be one unifying message
COMMUNICATING YOUR MESSAGE • Place materials logically on poster
COMMUNICATING YOUR MESSAGE • Be Creative
Common Pitfalls to Avoid • Title, variable labels, and/or value labels are not clear and user-friendly (e.g., no legend is provided) • Graph is incorrect for the type of data • 3-D items are not securely attached • Irregular-shaped posters (weigh creativity against ease of shipment/handling) • Topic is of marginal interest (consistent with grade level of students) • It is not obvious how the graphs connect • Graphs do not provide any new information (i.e., using a bar chart and a pie chart to relay the same information) • Spelling and/or grammar issues
2007 ASA Poster Competition WinnersK-3 S. Carson, A. DeVito, G. Hall, A. Sahadevan, L. Starkman, and I. Weil - Has There Been Diversity in the U.S. Presidency? Hathaway Brown Primary School, Shaker Heights, Ohio.
2007 ASA Poster Competition Winners4-6 B. Tilley - Are Hybrid Cars Really More Economical? Pine-Richland Middle School, Gibsonia, Pennsylvania
2007 ASA Poster Competition Winners7-9 M. Bonner - Favorite Fizz St. Aloysius Academy, Bryn Mawr, Pennsylvania
2007 ASA Poster Competition Winners10-12 C. Resnik, G. Burkhardt, and A. Pfrimmer - AFC vs NFC Peters Township High School, McMurray, Pennsylvania
2007 ASA Poster Competition Winners10-12 D. Tamarkin and A. Simon - Kids Vs. Adults: What They Think of the Drinking and Driving Ages Beachwood High School, Beachwood, Ohio
RESOURCES For further information on creating a statistics poster visit: www.gvsu.edu/stat/statposter and scroll to: Articles describing poster creation
TIMELINE • Jan. 15, 2008 – topic selection done • Feb. 1, 2008 – data collection done • Feb. 15 2008 – graphs done • March 1, 2008 – layout of posters • March 15, 2008 - posters done • April 1, 2008 – posters received deadline • April 19, 2008 – judging of posters
SEND POSTERS TO: Statistics Poster Competition American Statistical Association 732 North Washington Street Alexandria, VA 22314
WEBSITES TO VISIT • American Statistical Association Poster Competition http://www.amstat.org/education/index.cfm?fuseaction=poster1 • Michigan Statistics Poster Competition http://www.gvsu.edu/stat/statposter • Pennsylvania Poster Competition http://www.math.iup.edu/paposters • Nevada Poster Competitionhttp://www.nevada.edu/~nvasa • Connecticut Poster Competitionhttp://www.amstat.org/chapters/Connecticut/home/Poster/poster_index.htm • Ohio Poster Competition http://www.bio.ri.ccf.org/ASA/poster.html • New York City Poster Competition http://www.nycasa.org/2008postercompetition.html
www.gvsu.edu/stat/statposter John Gabrosek and Neal Rogness Department of Statistics Grand Valley State University Allendale, Michigan USA gabrosej@gvsu.edu rognessn@gvsu.edu