Download
1 / 2
20 likes | 141 Views
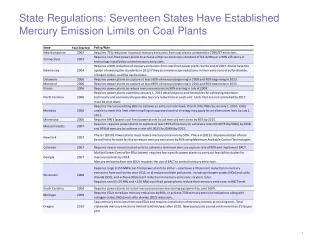
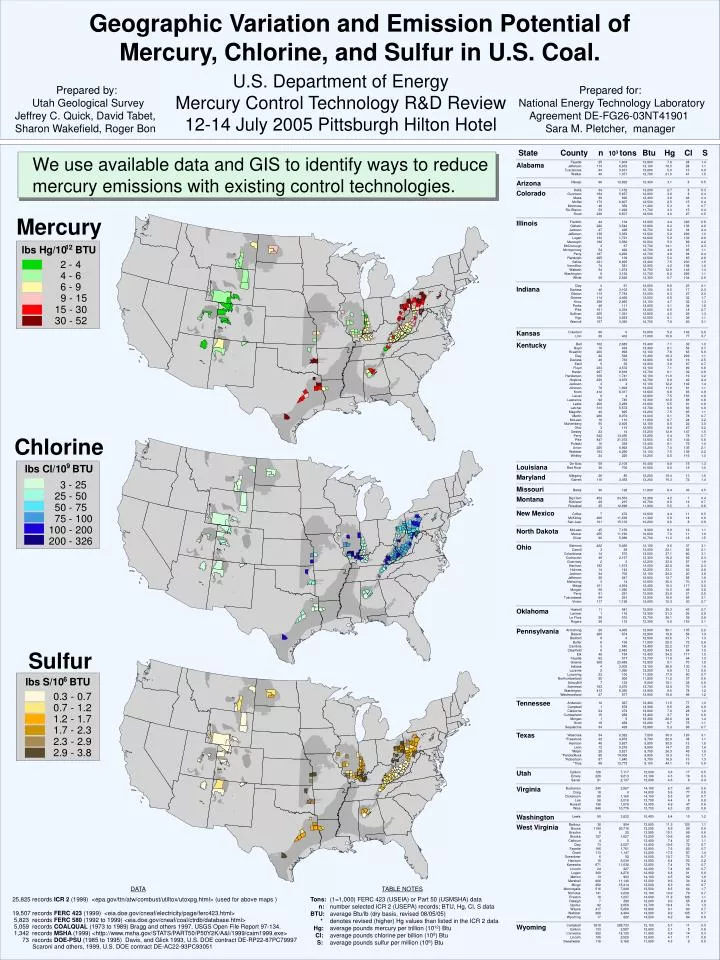
Geographic Variation and Emission Potential of Mercury, Chlorine, and Sulfur in U.S. Coal. County. n. 10 3 tons. Btu. Hg. Cl. S. Alabama. Arizona. Colorado. Illinois. Indiana. Kansas. Kentucky. Louisiana. Maryland. Missouri. Montana. New Mexico. North Dakota. Ohio. Oklahoma.

E N D
Geographic Variation and Emission Potential of Mercury, Chlorine, and Sulfur in U.S. Coal. County n 103tons Btu Hg Cl S Alabama Arizona Colorado Illinois Indiana Kansas Kentucky Louisiana Maryland Missouri Montana New Mexico North Dakota Ohio Oklahoma Pennsylvania Tennessee Texas Utah Virginia Washington West Virginia Wyoming U.S. Department of Energy Mercury Control Technology R&D Review 12-14 July 2005 Pittsburgh Hilton Hotel Prepared by: Utah Geological Survey Jeffrey C. Quick, David Tabet, Sharon Wakefield, Roger Bon Prepared for: National Energy Technology Laboratory Agreement DE-FG26-03NT41901 Sara M. Pletcher, manager State We use available data and GIS to identify ways to reduce mercury emissions with existing control technologies. Mercury Chlorine Sulfur DATA 25,825 records ICR 2 (1999) <epa.gov/ttn/atw/combust/utiltox/utoxpg.html> (used for above maps ) 19,507 records FERC 423 (1999) <eia.doe.gov/cneaf/electricity/page/ferc423.html> 5,823 records FERC 580 (1992 to 1999) <eia.doe.gov/cneaf/coal/ctrdb/database.html> 5,059 records COALQUAL (1973 to 1989) Bragg and others 1997, USGS Open File Report 97-134. 1,342 records MSHA (1999) <http://www.msha.gov/STATS/PART50/P50Y2K/A&I/1999/caim1999.exe> 73 records DOE-PSU (1985 to 1995) Davis, and Glick 1993, U.S. DOE contract DE-RP22-87PC79997 Scaroni and others, 1999, U.S. DOE contract DE-AC22-93PC93051 TABLE NOTES Tons: (1=1,000) FERC 423 (USEIA) or Part 50 (USMSHA) data n: number selected ICR 2 (USEPA) records; BTU, Hg, Cl, S data BTU: average Btu/lb (dry basis, revised 08/05/05) * denotes revised (higher) Hg values than listed in the ICR 2 data Hg: average pounds mercury per trillion (1012) Btu Cl: average pounds chlorine per billion (109) Btu S: average pounds sulfur per million (106) Btu
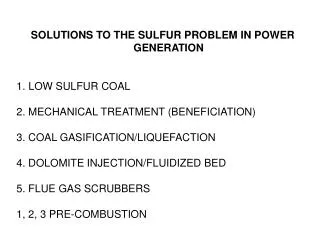
Pre-combustion Hg control (mining and washing) Mercury Capture 1,500 In-ground coal 11 lbs Hg/1012 BTU Delivered coal (1999) 8.3 lbs Hg/1012 BTU Difference 2.7 lbs Hg/1012 BTU In-ground coal Hg content (USGS COALQUAL data); 11 lb value is for coal producing counties weighted by Demonstrated Reserve Base tonnage (USEIA) aggregated by state. Mined coal Hg content from (USEPA ICR 2 data); 8.3 lb value weighted by 1999 production tonnage (USEIA or USMSHA) aggregated by county. Difference calculated for coincident COALQUAL and ICR 2 counties, weighted by 1999 coal production. Post-combustion Hg control Published Equations That Predict Mercury Capture Give Different Results (two examples) So We Use Their Average Result cESP Mercury Capture SDA/FF REFERENCES Roberson 2002, UARG variability analysis, <epa.gov/ttn/atw/combust/utiltox/epavarifnl.doc> SAIC 2003, Calculation of possible mercury MACT floor values, <netl.doe.gov/coal/E&WR/mercury/pubs/DOE_Report_v120803.pdf> ENSR 2003, Multivariable method to estimate the mercury emissions, <epa.gov/ttn/atw/combust/utiltox/final_ensr_multivar.pdf> EMISSION CONTROLS cESP cold-side electrostatic precipitator cESP/FGD cold-side electrostatic precipitator with wet flue-gas desulphurization hESP hot-side electrostatic precipitator hESP/FGD hot-side electrostatic precipitator with wet flue-gas desulphurization SDA/FF spray-dry adsorption with fabric filter NOTES Points on graphs show 162 U.S. counties (6 with >2,000 ppm Cl not shown), selected 1999 ICR 2 data Mercury Capture Potential Hg emissions, by control technology cESP cESP/FGD SDA/FF 54% of coal burned avg. 6.3 lbs Hg/1012 BTU 19% of coal burned avg. 3.4 lbs Hg/1012 BTU 3% of coal burned avg. 3.1 lbs Hg/1012 BTU NOTES coal burned is on an energy (BTU) basis, based on data from Chu and others, 2000, <epri.com/attachments/262300_EUEC_pchu_1-01.pdf> avg. lbs Hg is calculated as shown above, and shows potential emissions assuming all U.S. coal were burned in these technology classes, rather than the coals that are currently burned Implications - ways to reduce Hg emissions • Potential to further reduce Hg by mining/washing strategies (PA,OH,TX) • Select high-chlorine coal for cESP/FGD and SDA/FF technology • Select low-mercury coal for hESP, cESP and hESP/FGD technology • 500-1,000 ppm Cl blending target for cESP/FGD and SDA/FF technology • Select low-sulfur coal to improve Hg capture website: http://geology.utah.gov/emp/mercury/index.htm contact: jeffreyquick@utah.gov