Download
1 / 1
10 likes | 80 Views
Concentrations and Distribution of Arsenic in Drinking and Irrigation Water Supplies in Karbala, Iraq. Baker A. Joda, and Neil I. Ward. ICP-MS Facility, Chemical Sciences, Faculty of Health and Medical Sciences, University of Surrey, Guildford, Surrey, GU2 7XH. Introduction

E N D
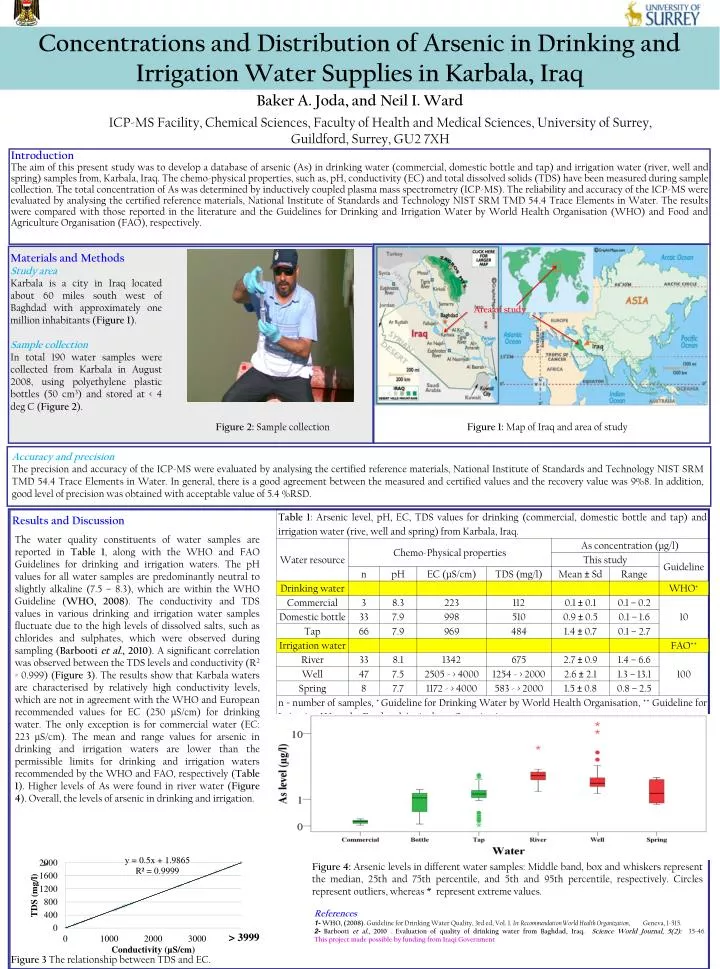
Concentrations and Distribution of Arsenic in Drinking and Irrigation Water Supplies in Karbala, Iraq Baker A. Joda, and Neil I. Ward • ICP-MS Facility, Chemical Sciences, Faculty of Health and Medical Sciences, University of Surrey, • Guildford, Surrey, GU2 7XH Introduction The aim of this present study was to develop a database of arsenic (As) in drinking water (commercial, domestic bottle and tap) and irrigation water (river, well and spring) samples from, Karbala, Iraq. The chemo-physical properties, such as, pH, conductivity (EC) and total dissolved solids (TDS) have been measured during sample collection. The total concentration of As was determined by inductively coupled plasma mass spectrometry (ICP-MS). The reliability and accuracy of the ICP-MS were evaluated by analysing the certified reference materials, National Institute of Standards and Technology NIST SRM TMD 54.4 Trace Elements in Water. The results were compared with those reported in the literature and the Guidelines for Drinking and Irrigation Water by World Health Organisation (WHO) and Food and Agriculture Organisation (FAO), respectively. Materials and Methods Study area Karbala is a city in Iraq located about 60 miles south west of Baghdad with approximately one million inhabitants (Figure 1). Sample collection In total 190 water samples were collected from Karbala in August 2008, using polyethylene plastic bottles (50 cm3) and stored at < 4 deg C (Figure 2). Area of study Figure 2: Sample collection Figure 1: Map of Iraq and area of study Accuracy and precision The precision and accuracy of the ICP-MS were evaluated by analysing the certified reference materials, National Institute of Standards and Technology NIST SRM TMD 54.4 Trace Elements in Water. In general, there is a good agreement between the measured and certified values and the recovery value was 9%8. In addition, good level of precision was obtained with acceptable value of 5.4 %RSD. Results and Discussion The water quality constituents of water samples are reported in Table 1, along with the WHO and FAO Guidelines for drinking and irrigation waters. The pH values for all water samples are predominantly neutral to slightly alkaline (7.5 – 8.3), which are within the WHO Guideline (WHO, 2008). The conductivity and TDS values in various drinking and irrigation water samples fluctuate due to the high levels of dissolved salts, such as chlorides and sulphates, which were observed during sampling (Barbooti et al., 2010). A significant correlation was observed between the TDS levels and conductivity (R2 = 0.999) (Figure 3). The results show that Karbala waters are characterised by relatively high conductivity levels, which are not in agreement with the WHO and European recommended values for EC (250 µS/cm) for drinking water. The only exception is for commercial water (EC: 223 µS/cm). The mean and range values for arsenic in drinking and irrigation waters are lower than the permissible limits for drinking and irrigation waters recommended by the WHO and FAO, respectively (Table 1). Higher levels of As were found in river water (Figure 4). Overall, the levels of arsenic in drinking and irrigation. Figure 4: Arsenic levels in different water samples: Middle band, box and whiskers represent the median, 25th and 75th percentile, and 5th and 95th percentile, respectively. Circles represent outliers, whereas * represent extreme values. References 1-WHO, (2008). Guideline for Drinking Water Quality, 3rd ed, Vol. 1. In: Recommendation World Health Organization,Geneva, 1-515. 2-Barbooti et al., 2010 . Evaluation of quality of drinking water from Baghdad, Iraq. Science World Journal, 5(2): 35-46.This project made possible by funding from Iraqi Government Figure 3 The relationship between TDS and EC.