Download

1 / 59
650 likes | 756 Views
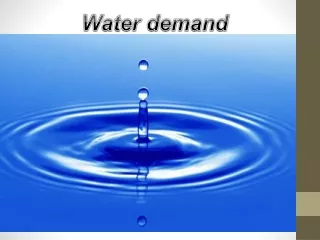
Water Demand Management (WDM). Lectures 3,4. Water Demand Management (WDM). Water Demand management aims at achieving desirable demands and desirable uses. It influences demand in order to use a scarce resource efficiently and sustainably.

E N D
Water Demand Management (WDM) Lectures 3,4
Water Demand Management (WDM) • Water Demand management aims at achieving desirable demands and desirable uses. It influences demand in order to use a scarce resource efficiently and sustainably. • WDM is not necessarily the same as decreasing water demand; in certain situations managing the demand may mean to stimulate the demand that had been suppressed, here we have to improve water services and increase water consumption • WDM uses technical, legal and economic incentives in combination with awareness raising and education; in order to achieve more desirable consumption patterns, both in terms of distribution between sectors and quantities consumed, coupled with an increased reliability of supply. • WDM is always concerned with increasing the efficient use of water. Minimizing leakages is often the most cost-effective strategy towards system's improvement.
Water Demand Management • Goals of demand-side management of water • Increased efficiency of water use • Safeguard the right of access to water for future generations • Improve allocation among competing users • Decreased need for large investments in infrastructure (like dams, Desalination Plants) • More cost effective water use • Changes to the nature of water demand and the way people use water
WDM Tools / Instruments • Technical / regulatory tools • Reduction of water losses • Leak detection and repair • Inspection of illegal connections • Modern irrigation techniques • More crop for drop • Improved O&M • Metering • Rationing • Cropping patterns • Timing and regulations of outdoor irrigation • Dual distribution system • Good quality for drinking and cooking • Lower quality for other uses • Internal recycling • Water savings appliances/devices • Automatic taps • Spray showers • Dual flush system • Rainwater harvesting / promote reclaimed WW (supply side)
WDM Tools / Instruments • Social tools • Behavioral changes • Public awareness • Education curricula • Economic tools • Water pricing • Increasing block tariff • Implementation incentives • Subsidies • Taxes • Loans • Promotions for compliance • Fines / penalties / fees • Legal tools • Policies / laws • Regulatory framework
Water Demand – Municipal &Industrial (M&I) • Factors: • Population and population density • Housing type and standard of living • Sanitation type • Climate conditions • Economic conditions and income level • Water availability – Rationing • Water quality • Pricing policies and tariff structure
Per - Capita Demand • Basic Human Needs • WHO (guidelines for small communities) • Average 150 l/c/d • Minimum 100 l/c/d
150 l/c/d 300 l/c/d 420 l/c/d 165 l/c/d Per - Capita Demand
الاحتياجات الفردية • المنزلي ( الاستعمال داخل المنزل )1 • الحد الادنى =100 لتر للفرد في اليوم • المتوسط = 150 لتر للفرد في اليوم • الخدمات العامة ( يشمل متطلبات المساحات الخضراء و الدفاع المدني ) • تقدر بحوالي 5% من الاجمالي • الصناعي • من 7% حاليا الى 14% في2020 * أقل من 15% من مصادر مياه الشرب تعتبر مطابقة للمواصفات المحلية 1- WHO guidelines for water supply systems in small communities
* * Based on PCBS including the returnees before 2000 الإحتياجات الإجمالية WSSPS, 2000
Population Similar to Water Balance • Growth rate: • dP/dt = change in population during time step (capita) • B = number of birth per unit of time (capita/year): • D = number of death per unit of time (capita/year) • I = immigration (capita/year) • O = emigration (capita/year) • L= life expectancy (year) b is the birth rate which the amount of children born per person during his/her life d is the death rate d = 1 : steady state situation d < 1 : population is growing where more young people than old people. d > 1 : more elder people than young people ( case of china b=0.5) where b < 1.
Population Ignoring immigration and emigration 1- if (b-d)> 0: more children are born than die 2- b=d: the population is constant. The exponential growth model can also be written as: Other models: Linear Model:
Population Example: Number of children 4 r=(4-2)/60=0.033 Number of children 5 r=(5-2)/60=0.05
Ps P t Population • Other models: Saturation model
Irrigation Water Demand ETo: Reference evapotranspiration: The evapotranspiration rate from a reference surface, not short of water. The reference surface is a hypothetical grass reference crop with specific characteristics
Factors Influencing Kc • Crop height: The crop height influences the aerodynamic resistance term (ra) of the FAO Penman-Monteith equation and the turbulent transfer of vapour from the crop into the atmosphere. • Albedo (reflectance) of the crop-soil surface. The albedo is affected by the fraction of ground covered by vegetation and by the soil surface wetness. The albedo of the crop-soil surface influences the net radiation of the surface, Rn, which is the primary source of the energy exchange for the evaporation process • Canopy resistance: The resistance of crop to vapour transfer is affected by leaf area (number of stomata), leaf age and condition, and the degree of stomatal control. The canopy resistance influences the surface resistance, rs • Evaporation from soil, especially exposed soil. Mid-season stage Late season stage Initial stage Crop development stage
Estimation of ET0 Penman-Monteith Method http://www.fao.org/docrep/X0490E/x0490e01.htm • ETo reference evapotranspiration [mm day-1], • Rn net radiation at the crop surface [MJ m-2 day-1], • G soil heat flux density [MJ m-2 day-1], • T mean daily air temperature at 2 m height [°C], • u2 wind speed at 2 m height [m s-1], • es saturation vapour pressure [kPa], • ea actual vapour pressure [kPa], • es - ea saturation vapour pressure deficit [kPa], • D slope vapour pressure curve [kPa °C-1], • γ psychrometric constant [kPa °C-1].
Tedious Calculations G ??? Rn ???
Epan Method ETo = Kp Epan • ETo reference evapotranspiration [mm/day] • Kp pan coefficient [-] • Epan pan evaporation [mm/day].
Effective Rainfall (USDAS-SCS Method) f = correction factor depends on average net application depth or soil moisture depletion before each irrigation P = the gross monthly rainfall in mm ET0 = the monthly reference evapotranspiration
Other Water Demands • Environmental Demand • Environmental flow: the quantity and quality of water required to sustain aquatic ecosystems and the ecological components, processes and functions on which people depend • Ecological functions of flow • Extreme low (drought) flows • Population regulation; life history cues • Low (base) flows • Provide habitat for aquatic biota, maintain water temperature and water chemistry, provide drinking water for terrestrial animals • High flows • Shape river channel, prevent encroachment of riparian vegetation, flush sediments and pollutants, maintain estuaries and floodplain • Hydropower • Power generation requirements E = P T = et egρ g Q H T
Water Pricing Dublin and Rio conferences, Agenda 21: Water should be managed as an economic good, provided water for drinking purposes and other basic needs are made available at prices that are widely affordable locally
Water Pricing make a key instrument for the implementation of Demand Management: • Increased price reduces the demand; • Increased price increases supply (firstly, because marginal projects may become affordable and secondly because it becomes attractive to reduce losses); • increased prices facilitate reallocation among sectors; • Increased prices improve managerial efficiency.
Cost of Water • Water pricing should have two purposes: • to recover costs • to enhance water use efficiency • External costs (economic externalities): environmental damage, pollution, effect on downstream users and health hazards • The economic price should also reflect the scarcity of the resource, which is generally expressed in the opportunity cost (the cost of not being able to use the resource for another social or economic activity).
The following questions to be answered: • How should we determine the full social cost with respect to long-term marginal social costs and external environmental cost? • How should we identify users (consumptive users, non-consumptive users and polluters) to which costs should be charged?
Goodman (1984) stated that : • The economic value of a product or service from a water resources is estimated as the amount of users are willing to pay for it. • This is not entirely true since water is essential to life and there is no alternative for it . • The variation of the willingness to pay can be conceptually shown by the curve of price per demand.
Q P • Assumptions: • constant incomes • constant preferences (willingness to pay or economic value of the water) Price vs. Demand where • Q is the quantity of demand for the good • P is the price of the good • c is a constant • E is the elasticity of demand (-1 , 0) (the slope of the curve) • Price • Type of use