Download

1 / 11
120 likes | 370 Views
Mean absolute deviation. Greg Morrison. Find mean absolute deviation . You have used range and the interquartile range to describe the spread of a set of data. You can also use the mean absolute deviation.

E N D
Mean absolute deviation Greg Morrison
Find mean absolute deviation • You have used range and the interquartile range to describe the spread of a set of data. You can also use the mean absolute deviation. • The mean absolute deviation of a set of data is the average distance between each data value and the mean.
Example • The Table shows the maximum speeds of eight roller coasters. Find the mean absolute deviation of the set of data. Describe what the mean absolute deviation represents.
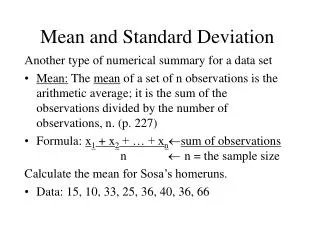
Step 1 • Find the mean • = • = • 64
Step 2: Find the distance of each data value from the mean(Hint: Subtract the lesser value from the greater value) • This gives us the absolute value (how far each number is from the mean)
Step 3: Find the mean of the distances • = • 12.5 • The mean absolute deviation is 12.5.
Step 4 (describe or interpret data) • This means that the average distance each data value is from the mean is 12.5 miles per hour.
Your Turn • The table shows speeds of ten birds. Find the mean absolute deviation of the data. Round to the nearest whole number. Describe what the mean absolute deviation represents. • What is the first Step?
Step 1 Find the Mean • = • = • The mean is 78.6 • or 79 • What is the next step?
Step 2: Find the distance of each data value from the mean(Hint: Subtract the lesser value from the greater value) • What is the next step?
Step 3 Find the mean of the distances • = • 12.2 or • The mean absolute deviation is 12