Download

1 / 34
340 likes | 448 Views
Introductory Statistics for Laboratorians dealing with High Throughput Data sets. Centers for Disease Control. Problem 14: Means of Samples. Draw a sample of size 2 from the population in the hat. Compute the mean of the sample. Write the mean of your sample on the pad.

E N D
Introductory Statistics for Laboratorians dealing with High Throughput Data sets Centers for Disease Control
Problem 14: Means of Samples • Draw a sample of size 2 from the population in the hat. • Compute the mean of the sample. • Write the mean of your sample on the pad. • Compute the average of the means on the pad. • Compute the standard deviation of the means on the pad.
Problem 14: Means of Samples • Draw a sample of size 3 from the population in the hat. • Compute the mean of the sample. • Write the mean of your sample on the pad. • Compute the average of the means on the pad. • Compute the standard deviation of the means on the pad.
Problem 14: Means of Samples • Draw a sample of size 4 from the population in the hat. • Compute the mean of the sample. • Write the mean of your sample on the pad. • Compute the average of the means on the pad. • Compute the standard deviation of the means on the pad.
Problem 14 • What do we know about the mean of the population in the hat? • Why aren’t the means of all the samples the same? • How accurate are the estimates of the population mean based on the sample means?
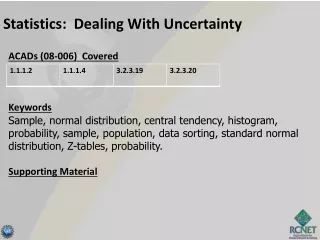
Definitions • Scientific research involves intensive study of small groups (called samples) in order to draw conclusions about much larger groups (called populations • Statistical inference uses techniques for drawing inferences or generalizations from samples to populations • Such inferences are always subject to error
Definitions • Population: a collection of objects, events, or individuals having a common characteristic that the researcher is interested in studying • Sample: a small set selected from the population for study • Population parameters are symbolized with Greek letters (theoretical distribution) • Sample statistics are computed by the researcher on her/his samples.
Definitions • The population mean (mu or μ) is the number the research is trying to estimate. • Each of the samples provides a mean ( ) that is an estimate of the population mean. • The variability of the sample means tells us about how much error there is in our research
Population from Problem 14 • The actual mean of the population is 5 and the variance is 4 • How close did the means of the samples come to the true population parameter? • Was the mean of the means closer? • Does sample size matter?
Population Distribution • The mean of the population is 5 • The variance is 4 • The population is not normally distributed • The theoretical distribution of the population is unknown
Problem 15 • List all possible samples of size 2 from the population in problem 14. (use pad provided) • Compute the mean of each sample. • Compute the mean of the sample means. • Compute the variance and standard deviation of the means (the variability of the means is an estimate of the amount of error in our inferences).
Problem 15 • There are 36 possible samples of size 2 • The table shows the first 14 • Here is a list of all 36 means: • 2, 2.5, 3.5, 4, 4, 5, 2.5, 3, 4, 4.5, 4.5, 5.5, 3.5, 4, 5, 5.5, 5.5, 6.5, 4, 4.5, 5.5, 6, 6, 7, 4, 4.5, 5.5, 6, 6, 7, 5, 5.5, 6.5, 7, 7, 8
Problem 15 • This is the distribution of the 36 means of samples of size 2 • is the mean of the means • is the variance of the means
Problem 16 • List all possible samples of size 3 from the population in problem 14. • Compute the mean of each sample. • Compute the mean of the sample means. • Compute the variance and standard deviation of the means (the variability of the means is an estimate of the amount of error in our inferences).
Problem 16 • The table shows the first 10 samples • There are a total of 216 possible samples (I really wrote them all out and computed the means of each).
Problem 16 • This is the distribution of the means of the 216 samples of size 3.
Problem 17 • List all possible samples of size 4 from the population in problem 14. • Compute the mean of each sample. • Compute the mean of the sample means. • Compute the variance and standard deviation of the means (the variability of the means is an estimate of the amount of error in our inferences).
Problem 17 • The table shows the first 10 samples • There are a total of 1296 possible different samples
Problem 17 • This is the distribution of the means of the 1296 samples of size 4.
Definition • Sampling Distribution of the Mean: the distribution of the means of all possible samples of size N
Summary • Population • Sampling Distribution of the Mean for Samples of N = 2 • Sampling Distribution of the Mean for Samples of N = 3 • Sampling Distribution of the Mean for Samples of N = 4
Central Limit Theorem • Given any population (with any distribution, normal or otherwise) with mean μ and variance σ2 , as the sample size increases the sampling distribution of the mean • Approaches a normal distribution with • Mean μ and • Variance
Effect of Sample Size on the Sampling Distribution • As the sample size gets bigger the standard deviation of the sampling distribution gets smaller. • Definition: • Standard Error: the standard deviation of the sampling distribution
Problem 18 • We are studying the attitude of people in the USA toward the President’s foreign policy. We use the following survey question: • Use the following scale to indicate your level of agreement or disagreement with the President’s foreign policy
Problem 18 • In a real survey we would not know the population mean or variance, we’d have to estimate them from data, but for purposes of this example, pretend we know that the mean agreement with the President’s foreign policy for the whole USA is 5 (slight agreement) with a variance of 4 (standard deviation of 2 points). • Use http://davidmlane.com/hyperstat/z_table.html • What ratings are 95% of the population between
Problem 18 • If the population were normally distributed, which it probably isn’t, 95% of it would be between 1.0801 and 8.9199. • The population is all over the place – all the way from approximately 1 to 9.
Problem 18 • We wish to use a sample of people to estimate the mean of the population (pretend we don’t know that the mean is 5 and the variance is 4). • We draw a sample of N = 10 people. Here are their ratings: 5, 5, 6, 3, 4, 5, 5, 6, 4, 5 • Since most of the people are in the middle of the population distribution, most of our sample is in the middle also. • The mean of the sample is 4.8 • The standard deviation of the sample is .87
Problem 18 • Sample size N = 10 • The mean of the sample is 4.8, the SD = .87 • The central limit theorem says the mean of samples of size 10 is approximately normally distributed with a mean = to the population mean and a variance = to the population variance / sample size. • Population variance / sample size is 4/10 = .4 • Standard error = square root of .4 = .623 • Compute the 95% confidence interval on the mean
Problem 18 • The central limit theorem tells us that when we draw samples of size 10 from this distribution 95% of the time the true mean will be between 3.57 and 6.02. • This is called the 95% confidence interval • This gives the accuracy of our estimate of the population mean. • We estimate the population mean is 4.8 (and we are 95% sure it is between 3.5 and 6.0) • The accuracy is plus or minus 1.3 points.
Problem 18 • Could we improve the accuracy by selecting a sample of 1000 people? N = 1000 • We survey 1000 people. The mean of the sample is 4.95 • The standard error is the square root of the population variance divided by the sample size = sqrt(4/1000) = 0.0623
Problem 18 • N = 1000 • The 95% confidence interval is from 4.83 to 5.07. • The accuracy is plus or minus .12 points
Problem 18 • The green graph is the sampling distribution for samples of size 10 • The red graph is the sampling distribution for samples of size 1000 • 95% of the red distribution is much closer to the true mean
Application • The central limit theorem is what makes political polling possible on election night. • It is easy for a major national polling firm to sample 10,000 people. • Then they are dividing by 100 (square root of 10,000) to get the standard error.
References • http://onlinestatbook.com/simulations/CLT/clt.html • http://onlinestatbook.com/stat_sim/sampling_dist/index.html • http://davidmlane.com/hyperstat/z_table.html