Download
1 / 29
290 likes | 451 Views
Chip-Assisted Analysis of Epithelial Transporter Proteins. Pascale Anderle, ISREC Lausanne. Overview. Introduction Transporters in the context of the whole genome Classification of transporters Introduction into microarray technology Overview on various microarray platforms

E N D
Chip-Assisted Analysis of Epithelial Transporter Proteins Pascale Anderle, ISREC Lausanne
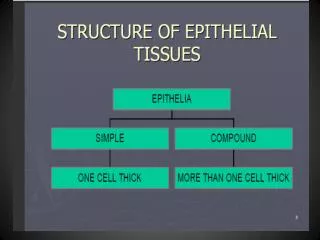
Overview • Introduction • Transporters in the context of the whole genome • Classification of transporters • Introduction into microarray technology • Overview on various microarray platforms • Strategies to select transporter genes and example studies • First example: Custom Array • Evaluation of transporter and channel genes in the intestine • Use of Hidden Markov Models • Summary • Second example: Affymetrix Platform • Genomic profiling of membrane transporters in the intestine • Gene Ontology Project • Importance of annotation • Isrec Ontologizer • Conclusions • Acknowledgment
Transporters in the Context of the Whole Genome Venter at al., Science 2001
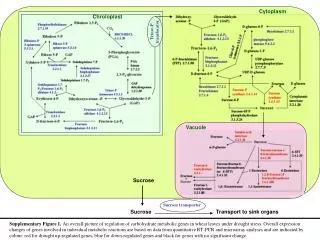
Membrane Transporter Proteins: Classification Facilitated diffusion Transport of substances across the membrane by means of uniporters. Transport is from an area of higher concentration to lower concentration. Passive transport powered by the potential energy of a concentration gradient and does not require the expenditure of metabolic energy Primary active transport Energy derived from the hydrolysis of ATP to ADP liberating energy from high energy phosphate bond Secondary active transport. Use of energy from another source-another secondary diffusion gradient set up across the membrane using another ion. Because this secondary diffusion gradient is initially established using an ion pump, as in primary active transport, the energy is ultimately derived from the same source-ATP hydrolysis. *Monoamine transporter, carrier ofdoxorubicin http://tcdb.ucsd.edu/tcdb http://lab.digibench.net/transporter/
Spotting: Photolithography Printing Physical support: Glass slide, nylon membrane Sample preparation and hybridization: cRNA vs. cDNA Single-labeling vs. dual-labeling Fluorescence vs. radioactivity Affymetrix: Short oligo chip Single labeling cDNA chip: Oligos or PCR products Dual-labeling Introduction into Microarray Technology Probes Oligomers PCR products
Custom array PCR products Oligomers Commercial array Short oligos: Affymetrix Long oligos: Agilent Chip preparation Probe design Probe preparation Printing Sample preparation cRNA/cDNA Labeling Hybridization Scanning Data Acquisition and Data Analysis Different Microarray Platforms Definition of biological questions Experimental design
Evaluation of Transporter and Channel Genes in the Intestine • Goals: • Caco-2 cells: Differentiated cells vs. undifferentiated cells • Small intestinal and colonic tissues vs. Caco-2 cells Anderle et al., Pharm Res 2003
Run hmmsearch against GenPept db Filter genes (human only, set cut off, eliminate red. genes) Keywords, seed sequences Search Pfam HMM db HMM Models Putative new genes Transporters: 670 Channels: 263 Run Pick70 Tm = 70, Palindrome Uniqueness = 15 bp Run Pick70 Run Pick70 Multiple alignment and selection of repr. genes Multiple alignment and selection of repr. genes 236 Contigs and singlets Assemble contigs Remove vector and characterized ESTs Protein seed sequence Converged PSI-Blast Core Protein Family Blast human EST db EST nucleotide sequence Probe Design for Custom Array Transporters: 316 Channels: 151 Contigs: 156 Positive Controls: 9 Negative Controls: 3 Controls (diff. Oligos): 9 RGS: 75 FGF/RGF-like: 7 ADAM family: 18 Brown et al. AAPS PharmSci. 2003 Anderle et al. Pharm Res. 2003
-3 -2 -1 0 1 2 3 -3 -2 -1 0 1 2 3 -3 -2 -1 0 1 2 3 -3 -2 -1 0 1 2 3 M-values M-values M-values 5 days vs. 3 weeks 5 days vs. 5 days 7 9 11 13 15 7 9 11 13 15 7 9 11 13 15 7 9 11 13 15 A-values A-values A-values A-values 5 days vs. 2 weeks 5 days vs. 1 week Differentiation of Caco-2 cells Time
Summary • Differentiation of Caco-2 cells: • During differentiation: Expression pattern changes • Up and down regulation usually < 2 fold • Significant changes between 5 days to 1 week and 1 week to 2 weeks • No significant changes between 2 weeks and 3 weeks • Genes in general related to ion household • No major differences between flasks and filters (except GLUT3) • Typical small intestinal transporters not especially up regulated in differentiated cells • Comparison Tissue vs. Caco-2 Cells: • Changes more pronounced between tissue and cell line than between undifferentiated and differentiated cells • Tissue vs. Caco-2 cells: More ratios > 2 fold • No trend observed: undiff. cells to diff. cells = colon-like to small intestinal-like cells
Ileum Colon Duodenum Jejunum Genomic Profiling of Membrane Transporters in the Intestine Objective: Identification of putative segment-specific and non-specific specific drug carriers Study Design: Triplicates → 3 Pools of 10 mice 12 x Mu74Av2 12 x Mu74Bv2 12 x Mu74Cv2
Gene Ontology Project ABCB1 Two pragmatic purposes of ontology: 1. Facilitate communication between people and organizations 2. Improve interoperability between systems Ontologies are structured vocabularies in the form of directed acyclic graphs (DAGs) that represent a network in which each term may be a “child” of one or more than one ”parent”.
Annotation Representative Sequence: Chosen during chip design as a sequence which is best associated with the transcribed region being interrogated BLAT threshold: Only records whose match / Qsize >= 75% and; only records whose score >= 0.70, where score = (match - mismatch - gap# x 5 - gap_size x 2) / Qsize; If record has several mapping locations with score > 0.70, choose the highest one; if a record has several mapping locations with the same highest score, all mapping locations kept. EnsMart Approach: cDNA sequence plus an additional length of downstream sequence immediately following the most 3' exon. The individual probe sequences are mapped, by exact matching. If more than 50 % of probes mapped, then listed as hits.
NetAffx A: 21545 EnsMart A: 15421 A: 3209 A: 796 A: 2686 B: 904 B: 22014 B: 5507 B: 8473 B: 499 A: 11269 B: 4027 A: 4381 A: 147 B: 8610 B: 77 A: 5085 B: 2533 NetAffx A: 22446 EnsMart A: 14220 A: 1193 Tagger A: 20882 A: 418 A: 2384 B: 169 B: 22112 B: 2462 B: 7300 B: 355 B: 15247 A: 12460 B: 1853 A: 6409 A: 149 B: 12790 B: 85 A: 2657 B: 1728 Tagger A: 21675 B: 16456 Comparison of Various Annotations Mouse MOE A and B Human U133 A and B
Mapped on: RefSeqs Mapped on: RefSeqs mRNAs ESTs HTCs Quality of Probe Sets
Io: Isrec Ontologizer Selection of hierarchical level Classification of probe sets Classification of UniGenes Classification of RefSeqs Flagging of ambiguous results Multiple probe sets per UniGene:addressed via flagging Multiple UniGenes per probe set:addressed via quality threshold(user defined annotation)
Io: Overview GO Consortium Affymetrix (Custom) Ontology Files Annotation Files Quality Files Probesets Results File Io engine independent from data structure: Can classify anything hierarchical, provided well structured files are given to the program. (E.g.: Simple extension to spotted arrays.) Flexibility improved by a single configuration file (v0.1.2).
UniGene Tagger UG ID Loc2UG Probe Set ID Loc2GO GO term RefSeq Tagger RefSeq ID Loc2ref Quality Filter UG ID Loc2UG Loc2GO GO term NetAffx Probe Set ID RefSeq ID Io: Annotation Organization Probe sets of interest IO classification
Functional classification of differentially regulated UGs along the Intestine
2 * SD according to lowess fitting 3 * SD according to lowess fitting Pair-wise Comparison: M vs A Plots M (log2 of fold change) vs A (log2 of absolute average intensity) plots of the pair-wise comparisons of the four intestinal segments. Highlighted are genes for which a significant difference was measured between the two segments of interest and for which the annotation was of “high” or “medium” quality.• differentially regulated genes, p (GEA) ≤ 0.05; • differentially regulated transporters p (GEA) ≤ 0.05; • differentially regulated transporters p (GEA) ≤ 0.01
Conclusions I Bioinformatic aspects: • Annotation provided by NetAffx does not catch the entire complexity of Affymetrix-based microarray experiments • Heterogeneous representation of genes on GeneChips: 1 unique probe set ≠ 1 unique gene • Need of coherent and comparable annotation when comparing results of microarray experiments • Filtering of genes using an annotation quality threshold • No significant bias in general regarding the distribution of the selected probe sets into the different molecular functions for the top hierarchical levels • Possible influence regarding the distribution of the selected probe sets into the different molecular functions at lower hierarchical levels • Functional classification of gene on the UniGene level and RefSeq level yields very similar results • Flagged genes ambiguous rather due to technical issues than due to the fact that splice variants may be differentially expressed
Conclusions II Biological aspects: • About 28 % of genes with transporter activity are differentially regulated along the intestine, thus, indicating that the majority of transporter genes are not segment specific. • Some transporters, however, or genes involved in transport activity* may be used as local specific drug targets such as: • The mRNA levels need to be quantified by quantitative RT-PCR. • The expression of SLC34A2, Xtrp3s1, CNT2, SLC10A2, SLC5A8, GLUT1, AI648912 will be measured in the villi, FAE and crypts using LDM and quantitative RT-PCR • Apoa1*, Fabp1*, Xtrp3s1, CNT2 for the small intestine • GLUT1 (Slc2a1), the amino acid transporter B0+ (Slc6a14) and the multidrug-resistance associated protein Abcc6 for the colon • Fabp1* might be an interesting target for absorption of fatty acid type drugs in the proximal small intestine • The tumor suppressor gene SLC5A8 seems to be highly expressed in the more distal part of the intestine, namely the ileum and the colon
Acknowledgments I UCSF/OSU Wolfgang Sadée Vera Rakhmanova Shoshana Brown Joe DeRisi Adam Carroll Jingchun Zhu Xenoport Katie Woodford Noa Zerangue National Cancer Institute John Weinstein Kimberly Bussey
Acknowledgments II ISREC Jean-Pierre Kraehenbuhl Martin Rumbo Bioinformatics Core Facility Mauro Delorenzi Thierry Sengstag Nestlé Gary Williamson Muriel Fiaux Robert Mansourian David Mutch Matthew-Alan Roberts Swiss Institute of Bioinformatics Philipp Bucher Viviane Praz Christian Iseli
Fluorescence signal of 22 probes 1 numeric value MAS5 or RMA ? Normalization across chips Comparability of chips Loess, quantile or others ? Statistical analysis of data Identification of differentially regulated probe sets Classical ANOVA or GEA ? GEA: SD a function of A Clustering of genes with similar expression profiles Identification of similarly regulated genes What clustering method ? Which measurement of similarity ? Functional annotation Identification of genes with similar functions Mapping to GO terms?