Download
1 / 22
220 likes | 228 Views
GPS Equipment for Agricultural Statistics Surveys: Lessons Learned From Fieldwork in Uganda - 2003. Presentation at the Third International Conference on Agricultural Statistics MEXSAI-ICAS-III Cancun, Mexico; 2 nd to 4 th November 2004. Authors:

E N D
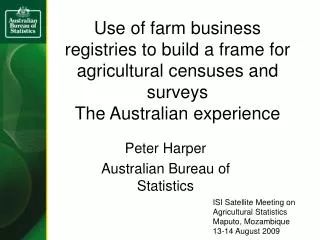
GPS Equipment for Agricultural Statistics Surveys:Lessons Learned From Fieldwork in Uganda - 2003 Presentation at the Third International Conference on Agricultural Statistics MEXSAI-ICAS-III Cancun, Mexico; 2nd to 4th November 2004 Authors: E. S. K. Muwanga-Zake, J. Magezi-Apuuli, E. Menyha and P. Schøning
Objective To discuss the results from a pilot census of Agriculture in Uganda which indicates that there is potential to use relatively cheap Global Positioning System (GPS) equipment for measuring of area and for geo-referencing of holdings in the context of agricultural statistics.
Presentation covers: 1. Introduction 2. Areas in the Context of Agricultural Statistics 3. Testing of GPS equipment during the Pilot Census of Agriculture, 2003 3.1 Experimental Design 3.2 Comparison of Results of Area Measurements 3.3 Comparison of Results of Time Taken 3.4 Comparison of Costs of the Instruments 3.5 Lessons Learnt 4. Conclusions 5. Issues and Further Work
Introduction • In Uganda no complete set of cadastral and/or land registers from which to get area information • Food and Agricultural Statistics in general and area statistics, in particular, very poor • During the Pilot Census of Agriculture (PCA) in Uganda, in 2003 it was decided to experiment with different methods and equipment for area, yield estimation, production estimation, compilation of conversion factors, etc.
Land is one of the most important factors of production Pattern of land use varies by season, region, etc. Area Measurement Used for: Determination of structural changes of agric. Holdings; and; Estimation of Agricultural Production by AREA x YIELD Areas in the Context of Agricultural Statistics
Comparative studies of methods and tools used for area measurement conducted under the PCA 2003 • Four Methods and tools tested were: • Holder’s/respondent’s Eye-estimate • Enumerator’s eye-estimates • Tape and Compass (traversing) • Global Positioning Systems (GPS) Equipment • Must ensure that the different Methods and tools are INDEPENDENT
Possible uses of the GPS Equipment Data Storing the track-log as vector datai.e. “cadastral mapping” Filling in questionnaires for area&coordinates i.e. traditional statistical approach
Build-in program for area calculation Satellite tracking <=12 Accuracy <=15 m Waypoint capacity <=500 Acquisition time 45 sec. Power source 4 x AA Battery life 24 hours* Operating temperature -15OC to +70OC High contrast display Features external antenna (GPS 12XL) Dimensions 2” x 6.15” x 1.23” Price GPS12: USD 149.50 Price GPS12XL: USD 229.00 Technical Specification (GPS)Garmin Handheld GPS 12 / GPS 12XL * Battery life less than 12h as batteries are changed when half of power is used.
Experimental Design (PCA)A trade-off between cost, enumerator’s capacity and scientific design • N = 900 holdings distributed on 60 EAs and 10 Districts • 3 strata of 5 holdings in each EA • Different area & crop measurement/estim-ation techniques applied to each stratum Holding group I -Holder’s area eye-estimate -Measure by tape&compass -Measure by GPS Holding group II + III -Enumerator’s area eye-estimate -Measure by GPS Equip.
Areas Measured (PCA) Holding, Parcels and Plots • The total area of the holding • Area of each parcel • Area of each crop-plot Plot 1 Maize&beans Plot 1 Homestead Parcel 2 Plot 3 Coffee Plot 2 Beans Parcel 1
Measuring area with GPSA fast and cost efficient method? • Fix the starting point • Walk the perimeter of the area (plot or parcel) • Calculate area either by: • (A) Storing of the track-log and calculate the area on a PC • (B) Calculate the area directly with the GPS tool and fill in the results on a form
Results from comparative studies (PCA)Results from traversing (tape&compass) compared with results from use of GPS – measuring area at parcel level
Results from comparative studies (PCA) cont.Measuring area at parcel level • The difference between the two means is highly insignificant and therefore the results obtained by the GPS tool are statistically not different from those obtained by traversing using tape & compass.
Results from comparative studies (PCA) cont.Minutes used to measure area per holding • 191 observations of time used where areas are both measured by traversing (tape & compass) and by GPS • On average GPS measure requires 28.5 percent of the time required for traversing the same areas
GPS Equipment Fairly expensive GPS model used cost about US$150 per Unit 3 Enumerators shared 2 GPS equipment Used 4 expensive high quality AA batteries @US$1.25 per pair Tape and Compass Tape about US$25 Compass about US$100 Need programmable calculator (fairly expensive) Enumerator needs assistance for tape Comparative Costs
Additional test I: Variation between tools using several GPS tools • 7 x GPS tools tested in 3 districts • Very little variance both between tools and for each tool when repeated observation in Wakiso • More variance both between tools and for each tool when repeated observation in Kabarole I-II (more difficult terrain?) • Too few observations to draw robust conclusions Measure of plot areas. m2
Plot area (m2) measured by GPS (January 2003) Plot area (m2) measured by GPS (January 2003) Plot area (m2) measured by GPS (January 2003) Statistics Statistics Statistics Std. Error Std. Error Std. Error Number of observations Number of observations Number of observations 22 22 22 Mean Mean Mean 474.14 474.14 474.14 5.73 5.73 5.73 95% Confidence Interval for Mean 95% Confidence Interval for Mean 95% Confidence Interval for Mean Lower Bound Lower Bound Lower Bound 462.22 462.22 462.22 Upper Bound Upper Bound Upper Bound 486.06 486.06 486.06 Median Median Median 482.50 482.50 482.50 Variance Variance Variance 722.89 722.89 722.89 Std. Deviation Std. Deviation Std. Deviation 26.89 26.89 26.89 Minimum Minimum Minimum 407.00 407.00 407.00 Maximum Maximum Maximum 510.00 510.00 510.00 Range Range Range 103.00 103.00 103.00 Additional test II: Variation over time using the same GPS tool Plot area measurement. Testing of variation of 1x GPS True value 483 m2 • 1 x GPS tool tested 22 times on the same area • Reasonable variation +/- around the true value • Mean of observations deviates 1.9 percent from the true value • Median of observations deviates 0.1 percent from the true value • The range is wide
Cost efficient tool with acceptable accuracy Easy to use even for trained non-experts The instrument gives “high-tech status” to the Enumerator i.e. built-in motivation for use Can also be used to geo-reference holdings (x/y coordinates) Set-up facilities are vulnerable for un-prescribed changes Battery consumption is high Steep slopes give inaccurate results (projection problems +) Dense tree canopy gives inaccuracy (consider to use extended antenna) Lessons learned using GPS
Conclusions • Area measurements by the GPS equipment and those by the compass and tape are very close – no statistically significant difference for parcel areas • Farmers overestimated areas for both parcels and plots compared to GPS and traversing technique. • GPS equipment is much faster and costs are fairly comparable to those of traversing, so there is a potential for the GPS equipment for agricultural area measurements • There is need for cheaper GPS equipment and reduction of running costs or at least more efficient use • There is also need for more thorough training of field staff. • More study is required on the variability and consistency of the equipment • Special studies concerning effects of steep slopes and under tree and cloud cover should also be conducted
Issues and Further Work • Can an international effort be made to develop a GPS version specifically for area measurement? • Are there other versions of the GPS equipment that can be more cost-efficient? • Could improve efficiency in use GPS tools e.g.switch off when not in use; more enumerators to share single equipment. • Could use re-chargeable batteries as more cost-efficient option.
GRACIAS A TODOS / Thanks you all The End