Download
1 / 5
50 likes | 56 Views
Supplementary Figure 1. Migration assay. Migration assay. Invasion assay. Invasion assay. PC3. DU145. PC3. DU145. PC3. DU145. PC3. DU145. mock. mock. mock. mock. control. control. control. control. miR-452. si-WWP1-1. si-WWP1-1. miR-452. si-WWP1-2. si-WWP1-2.

E N D
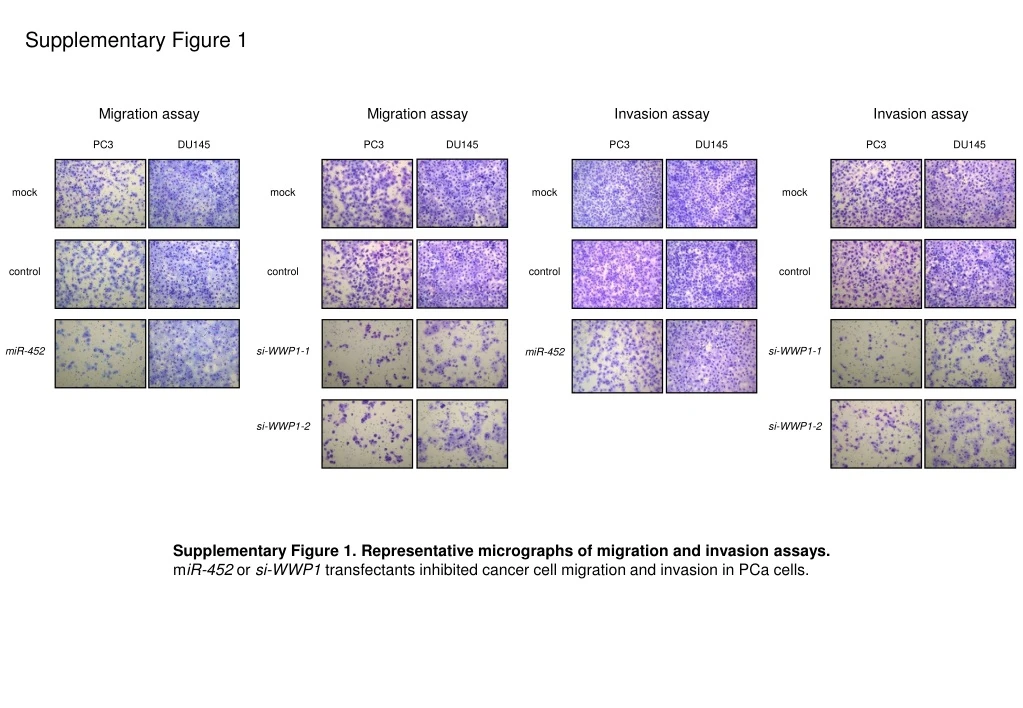
Supplementary Figure 1 Migration assay Migration assay Invasion assay Invasion assay PC3 DU145 PC3 DU145 PC3 DU145 PC3 DU145 mock mock mock mock control control control control miR-452 si-WWP1-1 si-WWP1-1 miR-452 si-WWP1-2 si-WWP1-2 Supplementary Figure 1. Representative micrographs of migration and invasion assays. miR-452 or si-WWP1 transfectants inhibited cancer cell migration and invasion in PCa cells.
Supplementary Figure 2 PC3 mock (%) 140 120 control 100 Cell migration(relative to mock) 80 60 40 miR-224 20 0 mock control miR-224 miR-452 miR-452 miR-224 + miR-452 miR-224 + miR-452 Supplementary Figure 2. Effects of co-transfection of miR-224 and miR-452 on migration assay Co-transfection of miR-224 and miR-452 did not show synergistic effects on cancer cell migration compared with miR-224 or miR-452 transfection in PC3 cells.
Supplementary Figure 3 TargetScan Database (release 6.2) 3,161 putative miR-452 target genes GEO Database PCa expression data (GSE 29079) Fold change (log2 ratio) > 0.1 704 candidate genes Gene expression analysis miR-452 transfection into PC3, DU145 (GSE 56243) Fold change (log2 ratio) < -0.2 10 genes Supplementary Figure 3. Strategy for selecting putative target genes of miR-452. The TargetScan program showed that 3,161 genes had putative target sites for miR-452 in their 3′ UTRs. A total of 704 genes were significantly upregulated in PCa specimens (log2 ratio > 0.1) in GSE 29079. Finally, we performed genome-wide gene expression analysis using PC3 and DU145 cells (GSE56243). Genes downregulated (log2 ratio < -0.2) by transfection with miR-452 were selected as putative target genes.
Supplementary Figure 4 A PC3 DU145 (%) (%) 120 120 100 100 80 80 Expression of mRNA WWP1 (relative to mock) 60 60 * * 40 40 * * 20 20 0 0 mock mock control control si-WWP1-1 si-WWP1-2 si-WWP1-1 si-WWP1-2 B si-WWP1-1 si-WWP1-2 si-WWP1-1 si-WWP1-2 control control mock mock WWP1 GAPDH Supplementary Figure 4. Effects of silencing WWP1 mRNA and protein expression by si-WWP1transfection in PCa cells. (A) WWP1 mRNA expression was determined at 72 h after transfection with si-WWP1. GUSB was used as an internal control. (B) WWP1 protein expression was evaluated by western blotting at 72 h after transfection with si-WWP1. GAPDH was used as a loading control. *P < 0.0001. The bars indicate SDs.
Supplementary Figure 5 P = 0.002 1100 1000 900 800 700 Expression of WWP1 600 500 400 300 200 100 0 Primary PCa (n = 65) Metastatic PCa (n = 25) Supplementary Figure 5. WWP1 expression in metastatic PCa and primary PCa. Expression levels of WWP1 were significantly higher in metastatic PCa compared with primary PCa (GEO accession number: GDS2545).