Download
1 / 14
160 likes | 427 Views
6.1 Solving Linear Systems by Graphing. Standard: SWBAT solve a system of two linear equations in two variables and are able to interpret the answer graphically. http://apod.nasa.gov/apod/ap081212.html. Lick Observatory Moonrise. Mini Quiz 48. Is the ordered pair a solution to the equation

E N D
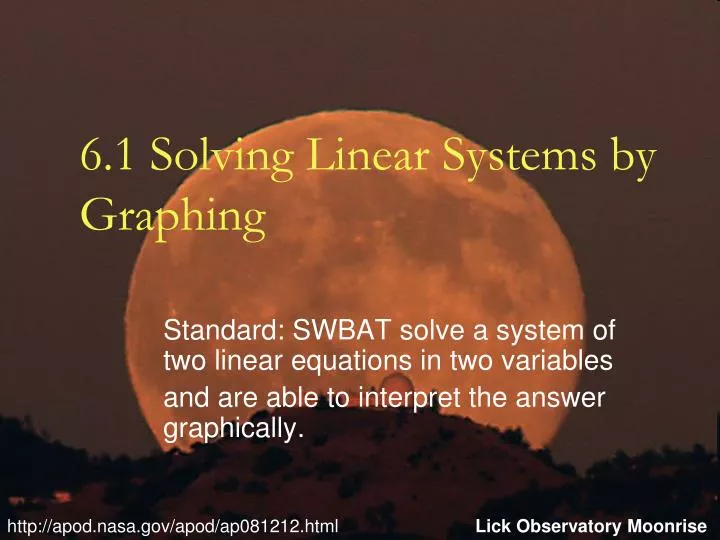
6.1 Solving Linear Systems by Graphing Standard: SWBAT solve a system of two linear equations in two variables and are able to interpret the answer graphically. http://apod.nasa.gov/apod/ap081212.html Lick Observatory Moonrise
Mini Quiz 48 Is the ordered pair a solution to the equation 2x – 3y = 5 • (1, 0) • (4, 1) • Graph the line 2x – y + 3 = 0
Overview • Solving Systems of Linear Equations (two equations) by Graphing • Understanding No Solution • Understanding Infinite Solution
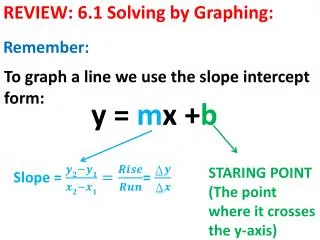
Graphing Lines Quick Review What are the different ways to graph a line? • T-chart • Slope-Intercept Form: y = mx + b • x- and y-intercepts: Using Standard Form: Ax + By = C Graph the line x – 2y – 4 = 0
Graphing Systems of Linear Equations Step: • Graph each line on the same coordinate plane • Label the point (ordered pair) where the lines cross (intersect) • Check your answer (YES, you need to check both equations!)
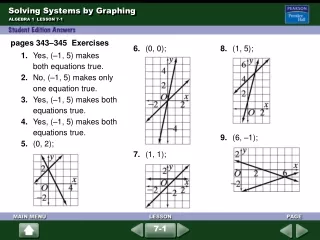
Graphing Lines Solve the Systems by Graphing 1. Check: (1, 2) y = 3x – 1 2 = 3(1) – 1 2 = 3 – 1 2 = 2 y = -2x + 4 2 = -2(1) + 4 2 = -2 + 4 2 = 2 Where do the lines cross? (1, 2)
Graphing Lines Solve the Systems by Graphing 2. Check: (1, -3) y = 4x – 7 -3 = 4(1) – 7 -3 = 4 – 7 -3 = -3 Where do the lines cross? (1, -3) y = -3x -3 = -3(1) -3 = -3
Graphing Lines Solve the Systems by Graphing 3. Check: (-1, 5) y = 2x + 7 5 = 2(-1) + 7 5 = -2 + 7 5 = 5 y = x + 6 5 = (-1) + 6 5 = 5 Where do the lines cross? (-1, 5)
Special Cases – No Solution and Infinitely Many Solutions No SolutionsInfinitely Many Solutions 4. 6. 5. 7. Solve for y and look at the equations, what do you notice about the equations? Same slope Different y-intercept Same slope Same y-intercept
Graphing Lines Solve the Systems by Graphing 8. x-intercept (x, 0) 3x = 12 x = 4 y-intercept (0, y) 3y = 12 y = 4 (4, 0) Where do the lines cross? No Solution (0, 4)
Graphing Lines Solve the Systems by Graphing 9. Where do the lines cross? Infinitely Many Solutions x-intercept (x, 0) 3x = -3 x = -1 y-intercept (0, y) y = -3 (-1, 0) (-1, 0) (0, -3)
Graphing Lines Solve the Systems by Graphing 10. Slope-intercept form 2x + y = 0 y = -2x Where do the lines cross? No Solution
Application 11. Suppose you have $20 in your bank account. You start saving $5 each week. Your friend has $15 in her account and is saving $10 each week. When will you and your friend have the same amount of money in your account? y = 5x + 20 y = 10x + 5 After 3 weeks! 35 30 25 20 15 10 5 Amount Saved 1 2 3 4 5 6 Number of Weeks
Wrap Up • Solving Linear System by Graphing • Graph each line • Find where they cross • Check solution HW: P. 279 #13-23 odd, P. 281 #43-51 odd DLUQ: When graphing a linear system, where do you find the solution?