Download
1 / 17
170 likes | 305 Views
Energy and Inequity. Presented by Community Solutions Yellow Springs, Ohio www.communitysolution.org. The Real Need For Change – Inequity. Energy concern Most U.S. concerns are driven by environmental degradation But environmentalists blame producers and not consumers

E N D
Energy and Inequity Presented by Community Solutions Yellow Springs, Ohio www.communitysolution.org
The Real Need For Change – Inequity • Energy concern • Most U.S. concerns are driven by environmental degradation • But environmentalists blame producers and not consumers • The world driving issue is accelerating inequity and violence • Comes from past and current colonialism • Current colonialism is Globalization and Corporatism • A world historical perspective is vital • We must understand wealth allocation (OECD and ROW) • We must understand relationship of energy to wealth • Ignorance can lead to war
Increasing Inequity • Distribution of worlds income in fifths (quintiles) • Third world view – experiencing accelerating inequity • OPEC nations fit the third word profile – they are poor! • Smaller annual income than the non-OECD world
Income by Region – 1 ($) 1820 & 1998 • The End of Poverty – Jeffrey Saks 2005 • OECD vs. ROW
Income by Region – 2 ($) 1820 & 1998 • OECD 18% (1st world) - ROW 82% (3rd world) No “2nd” world
Analyzing World Energy and Equity • Understand the World Alliances – G7, OECD, OPEC • Evaluating the fundamentals Life Span Income Equity Energy Used Military Expenditures • These are more significant than politics, religion, race, sex • Identify key trends • GINI Index of Inequity Changes • Oil Consumption Changes • OPEC Dynamics
Major World Groupings • G7 – US, UK, Canada, Germany, France, Italy, Japan • OECD – Organization for Economic Co-operation and Development • 30 Nations – 18% of population • Most of Europe – 21 Continental Europe • Anglo-Americans – US, Canada, UK, Australia, NZ • China fringe states – Japan, South Korea • U.S. and Europe fringe states – Mexico, Turkey • The Rich Nations • ROW – Rest of World – All nations (~ 150 nations) except OECD • 82% of population • The Poor Nations
Key Comparative Parameters • Pop - Population Size (shown in millions) • Life Span (Years) • PPP - Purchasing Power Parity per Capita • Represents comparative income (GDP($)/population) • KgOE/c - Energy usage per capita (kilograms of oil equivalent) • GINI Index – a measure of inequity • The higher the GINI number the greater the inequity • MilExp/c - Military expenditures per capita (in $)
The World Division • Pop - Population size in millions • Life Span (Years) • PPP – Purchasing Power Parity - Income • KgOE/c - Energy usage per capita (KgOE – kilograms of oil equivalent) • GINI Index – a measure of inequity • Military expenditures per capita (dollars)
Population Distribution • OECD 18%, ROW 82%
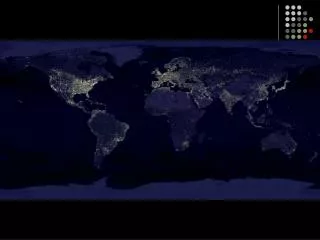
Asymmetric Energy Use – World View • Population • US (5% of pop.) ~300 mln. • OECD-L (10% of pop) ~700 mln. • ROW (85% of pop) ~5,400 mln. • Energy Consumption (BOE) • US – 57.5 • OECD-L – 30.6 • ROW – 7.3 • OECD-L is Europe, Japan, South Korea, Australia, Canada
GINI Index of Inequity • U.S. ranks first in inequity
GINI Index of Inequity Changes • Inequity accelerating: • 1960 to 1980 – 10%; 1980 to 1999 – 16%
U.S. Inequity • The top five percent increased their share of the income from 16.6% in 1970 to 22.4% in 2000. • In 2001, the amount of income going to the top 20% passed the 50% mark for the first time since the Great Depression
Energy, CO2, Equity – Correlation • U.S. (5% of pop.), OECD (10% of pop.), ROW (85% of pop.) • 300 million people use 56 boe/capita yearly • 1 billion people use 30.6 boe/capita yearly • 5.4 billion people use 7.3 boe/capita yearly • U.S. Ratio to ROW – 8 to 1
Conclusions • Inequity has been increasing for a century • Now the rate is accelerating • Consumer capitalism offers rational – the Trickle Down theory • “The rich are getting richer faster but everybody is getting a little bit richer so don’t complain” • When Peak Oil arrives, salaries and wealth will decrease • Will we accept the current inequities when people are hungry? • Current institutionalized inequity cannot survive Peak Oil