Download
1 / 37
370 likes | 373 Views
Range as a Measure of Variation. Lesson Overview (1 of 7). Lesson Overview (2 of 7). Lesson Overview (3 of 7). Lesson Overview (4 of 7). Lesson Overview (5 of 7). Lesson Overview (6 of 7). Lesson Overview (7 of 7). Warm Up.

E N D
Warm Up OBJECTIVE: SWBAT distinguish between measures of center and measures of variation and use range as a measure of variation to describe data distributions. Language Objective: SWBAT explain why the range is a useful tool for analyzing data. Ten students decide to have a pizza party and each is asked to bring his or her favorite pizza. The amount paid (in dollars) for each pizza is shown in the line plot below. • What is the mean price paid for pizza? • Two more students show up for the party and they have contributed no pizza. What is the mean of the data now? $12.40 $10.33 Challenge: How many more students without pizza would have to show up to bring the mean price below $8.00? : 4 students Scaffolding Agenda
Agenda: OBJECTIVE: SWBAT distinguish between measures of center and measures of variation and use measures of variation to describe data distributions. Language Objective: SWBAT explain why the range is a useful tool for analyzing data. • Warm Up – Review of the Mean (Individual) • Launch – Packing a Suitcase (Whole Class) • Explore – Finding the Range (Individual) • Practice – Creating Data Sets (Partner) • Assessment – Narrow vs. Wide Range (Individual) • Summary – When is the Range Useful? (Whole Class)
Launch – Review Turn and Talk (30 sec) number of toppings students like When we analyze data, what are we looking for? Median Center Mean Today! Range Spread (Measure of Variation) Interquartile Range Mean Absolute Deviation Shape Agenda
Launch: Packing a Suitcase Whole Class Humberto is going to Massachusetts for vacation. According to the weekly forecast, while he is there the median temperature will be 74° and the mean temperature will be 67°. Jim is going to California for vacation. According to the weekly forecast, while he is there the median temperature will be 66° and the mean temperature will be 64°. Agenda
Launch Think-Pair-Share Median: 74° Mean: 67° Median: 66° Mean: 64° What type of clothing should Humberto and Jim pack in their suitcases? Agenda
Launch Turn-and-talk Weekly Weather Forecast (in °F) Boston San Francisco After seeing the forecast, would you suggest that Humberto or Jim add or remove anything from their suitcases? Use evidence from the weather forecast to support your answer. Agenda
Launch Turn-and-talk The range in temperature is very different for the two cities. What does range mean? Agenda
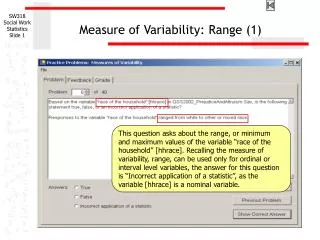
Launch Vocabulary What is the definition of range? The range is the difference between the least value and the greatest value in a set of data. Range = largest value (maximum) – smallest value (minimum) Examples of data sets with a Narrow Range: • Milk prices • Age of 6th graders Examples of data sets with a Wide Range: • House prices • Age of teachers 17 – 6 = 11 range 15 6 8 17 12 9 13 Agenda
Launch Notes Weekly Weather Forecast (Daily High Temperatures) Boston Boston: 83 – 46 = 37° San Francisco SF: 67 – 59 = 8° What is the range of temperatures in Boston and San Francisco? Agenda
Launch Think-Pair-Share Median: 74° Mean: 67° Range: 37° Median: 66° Mean: 64° Range: 8° A measure of center (median and mean) uses one number to summarize or represent a set of data. What is the purpose of this measure of variation (range)? Agenda
Explore – Part 1 Part 1 – (5 Min) Work independently and check in with a partner to complete your class work. 1-Worksheet 2-Share Out Click on the timer! In 5 minutes you will be asked to stop and share your answers! Agenda
Explore – Complete Front of Worksheet Part 1 – (5 Min) Agenda
Explore – Student Share Out Part 2 – (10 Min) Students share out work. Classwork Questions Agenda
Explore – Sharing Question #1 A = $4.70 $5.29 $4.99 $3.79 $0.95 $0.59 Based on the pictures, what is the range of fruit prices? Agenda
Explore – Sharing Question #2 A ≈ 11 inches Based on the bar graph, approximately what was the range of precipitation in Long Beach in 2011? Agenda
Explore – Sharing Question #3 Based on the line plot, what is the range of the number of children in a household? A = 7 children Agenda
Explore – Sharing Question #4 A = 19 inches (height) A = 19 inches (arm span) Based on the table, what is the range of heights? What is the range of arm spans? Agenda
Explore – Sharing Question #5 Based on the table, what is the range of the number of pets? A = 21 pets Agenda
Practice – Create Your Own Data Sets (10 Min) Students create their own data sets based on given characteristics. Practice Agenda
Practice – Complete Back of Worksheet (10 Min) Agenda
Classwork Summary – Sharing Question #7 Write a data set of any 5 numbers that has both of the characteristics given below. • range equal to 7 • mean equal to 4 Agenda
Assessment – Narrow or Wide Range? • On the index card in front of you, complete the following: • Write your name on the top (on the front) • On the front of the index card, write an example of a data set that would have a widerange. Explain your reasoning. • On the back of the index card, write an example of a data set that would have a narrowrange. Explain your reasoning. • You have 3 minutes! Agenda
Summary – Usefulness of the Range Students learn when the range is a useful measure of variation. Summary Agenda
Summary Whole Class Based on the line plot, what was the range of temperatures in Las Vegas from November 1 – 15, 2011? 80 – 59 = 21° Agenda
Summary Small Group The range of our data is 21°. Does this measure give an accurate picture of the overall variability in the data? NO!! Agenda
Summary Think-Pair-Share What?! My teacher told me to use the range to describe data. Now she is telling me the range is not always useful. When is it useful? Should I just flip a coin if I am not sure when to use it? Agenda
Summary Small Group For which sets of data would the range give a reasonable picture of overall variability? a. b. c. d. Agenda
Summary Whole Class Since the range is greatly influenced by outliers, we also use the interquartile range (IQR) to describe the variability of a data set. Agenda
Summary – Preview number of toppings students like When we analyze data, what are we looking for? Median Center Mean Range Tomorrow! Spread (Measure of Variation) Interquartile Range Mean Absolute Deviation Shape Agenda