Download
1 / 13
130 likes | 271 Views
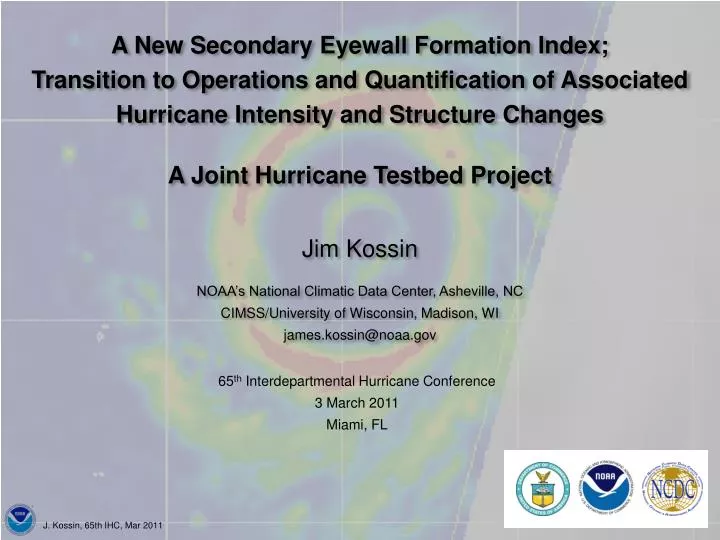
A New Secondary Eyewall Formation Index; Transition to Operations and Quantification of Associated Hurricane Intensity and Structure Changes A Joint Hurricane Testbed Project. Jim Kossin NOAA’s National Climatic Data Center, Asheville, NC CIMSS/University of Wisconsin, Madison, WI

E N D
A New Secondary Eyewall Formation Index; Transition to Operations and Quantification of Associated Hurricane Intensity and Structure Changes A Joint Hurricane Testbed Project Jim Kossin NOAA’s National Climatic Data Center, Asheville, NC CIMSS/University of Wisconsin, Madison, WI james.kossin@noaa.gov 65th Interdepartmental Hurricane Conference 3 March 2011 Miami, FL
CIMSS / UW-AOS personnel: • Matt Sitkowski • Chris Rozoff • NOAA-RAMMB / CIRA collaborators: • Mark DeMaria • John Knaff • NHC operations advisors: • Robbie Berg • Eric Blake • Jack Beven • John Cangialosi • James Franklin • Todd Kimberlain • Chris Landsea • Chris Sisko • Neal Dorst (HRD) • Shirley Murillo (HRD)
JHT project goals: Transition a new model to operations that provides probabilistic forecasts of eyewall replacement cycle events in hurricanes. Utilize low-level aircraft reconnaissance data to construct the first general climatology of intensity and structure changes associated with eyewall replacement cycles. Apply the new climatology toward constructing new operational tools to forecast intensity changes associated with eyewall replacement cycles.
The PERC model (Probability of Eyewall Replacement Cycle) Statistical/empirical model transitioned to operations prior to the start of the 2010 hurricane season. Executes within SHIPS using environmental and satellite-based features as input. Provides probability of the onset of an eyewall replacement cycle at lead-times: 0−12h, 12−24h, 24−36h, 36−48h. *Original model research and development was supported by the Office of Naval Research and the NOAA GOES-R Risk Reduction programs. Kossin, J. P., and M. Sitkowski, 2009: An objective model for identifying secondary eyewall formation in hurricanes. Mon. Wea. Rev., 137, 876-892.
Operational SHIPS text output file Intensity forecasts Rapid Intensification Index (RII) Annular Hurricane Index (AHI) Probability of Eyewall Replacement Cycle (PERC)
PERC-model verification: Brier Skill Score • “Perfect” intensity/track/environment • 1997−2006 leave-one-year-out cross-validated skill: • Brier Skill Score = +21% (00−12 hr lead-time) • BSS range among 10 individual years: −23% (1997) to +33% (2003) OperationalBrier Skill Scores
PERC-model verification: Reliability “Perfect” int/trk/env (1997−2006 cross-validated) 2008−2010 Operational verification ~15 ~15 ~15 ~60 ~800
Ongoing Year-2 Goal: Construct a climatology of intensity and structure changes associated with eyewall replacement cycles (ERC) • An ERC is forecast to occur or is underway. The forecast questions: • How long will it last? • How much weakening will occur? Over what period of time? • How much re-strengthening? When will it re-strengthen? • Subjective expectation during ERC: • Intensification rate decreases or weakeningoccurs • Re-intensification • Wind field expands significantly outwards • We want to better quantify these effects and ultimately build forecast tools from them. Best track intensity data are too smoothed in time to capture the transient effects, so a large archive of flight-level data was constructed. } transient effect permanent effect
The 3 Phases of an Eyewall Replacement Cycle expected intensity evolution without ERC Coherent secondary wind maximum appears intensity intensity forecast adjustment I II III well-defined secondary convective ring appears in microwave imagery time
Building new forecast tools Goal: Form tools to reduce large variance ΔV’,Δt ~ f (environment, satellite, etc) ΔV’is deviation from SHIPS forecast Note: We are also determining structure changes (e.g. R50)
Summary The PERC-model was successfully transitioned into NHC operations and performed skillfully during the 2010 season. Flight-level data have revealed a rich spectrum of behaviors associated with eyewall replacement cycles and have identified 3 distinct phases that are highly relevant to intensity forecasting. Remaining Goals: Complete the flight-level climatologies and exploit toward building new intensity forecast tools.
r2 r1 v1 v1