Download
1 / 52
520 likes | 724 Views
OET 2008 La Selva Biological Station February 2, 2008. Mortality trajectories for tropical trees in variable environments. Carol C. Horvitz University of Miami, Coral Gables, FL C. Jessica E. Metcalf Duke Population Research Center, Durham, NC Shripad Tuljapurkar

E N D
OET 2008 La Selva Biological Station February 2, 2008 Mortality trajectories for tropical trees in variable environments Carol C. Horvitz University of Miami, Coral Gables, FL C. Jessica E. Metcalf Duke Population Research Center, Durham, NC Shripad Tuljapurkar Stanford University, Stanford, CA
OET 2008 La Selva Biological Station February 2, 2008 A time to grow and a time to die Carol C. Horvitz University of Miami, Coral Gables, FL C. Jessica E. Metcalf Duke Population Research Center, Durham, NC Shripad Tuljapurkar Stanford University, Stanford, CA
Mortality rate: patterns and biological processes? Evolutionary theory predicts: Mortality, the risk of dying in the near future given that you have survived until now, should increase with age ?
Definitions • lx Survivorship to age x number of individuals surviving to age x divided by number born in a single cohort • μx Mortality rate at age x risk of dying soon given survival up to age x
Calculations • μx =- log (lx +1 / lx ) • in other words: the negative of the slope of the survivorship curve (when graphed on a log scale) log (Survivorship) Age
Mortality rate: patterns and biological processes? Evolutionary theory predicts: Mortality, the risk of dying in the near future given that you have survived until now, should increase with age ?
Mortality rate: patterns and biological processes? ? Plateau
Mortality rate: patterns and biological processes? ? Negative senescence
Gompertz (1825) 1. Age-independent and constant across ages 2. Age-dependent and worsening with age
A third possibility 1. Age-independent and constant across ages 2. Age-dependent and worsening with age A third possibility 3. Age-independent but not constant across ages Death could depend upon something else and that something else could change across ages.
Relevant features of organisms withEmpirically-basedstage structured demography • Cohorts begin life in particular stage • Ontogenetic stage/size/reproductive status are known to predict survival and growth in the near future • Survival rate does not determine order of stages
Age-from-stage theory • Markov chains, absorbing states • An individual passes through various stages before being absorbed, e.g. dying • What is the probability it will be in certain stage at age x (time t), given initial stage? • The answer can be found by extracting information from stage-based population projection matrices Cochran and Ellner 1992, Caswell 2001 Tuljapurkar and Horvitz 2006, Horvitz and Tuljapurkar in press
Some plant mortality patterns Silvertown et al. 2001 fitted Weibull models for these but...
Proportion in each stage Horvitz and Tuljapurkar in press, Am Nat
Mortality plateau in variable environments Megamatrix μm= - logλm Before the plateau things are a little messier, powers of the megamatrix pre-multiplied by the initial environment’s Q(Tuljapurkar & Horvitz 2006) c22
Mortality plateau in variable environments Megamatrix μm= - logλm Before the plateau things are a little messier, powers of the megamatrix pre-multiplied by the initial environment’s Q(Tuljapurkar & Horvitz 2006) matrix of transitions (no reproduction) for env 1 probability of changing from env 2 to env 1 c22
Conclusions and results • Age-from-stage methods combined with IPM’s increase library of mortality trajectories • Pioneer, canopy and emergent tropical trees solve the light challenge differently • Single time step growth and survival peak at intermediate sizes • Mortality trajectories asymmetrically “bath tub”-shaped • Life expectancies ranged from 35 to > 500 yrs • Small plants may reach canopy sooner than large ones ! • Empirically-based stage structured demographic processes : a third perspective on death
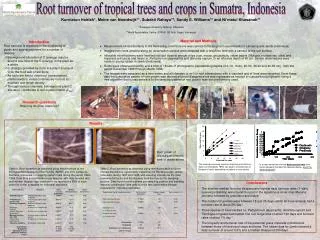
Application to ten tropical trees in a Markovian environment • Pioneer, canopy and emergent species • Diameter • (+/- 0.3 mm) • CI index • Every yr for 17 yrs • 3382 individuals • 1000 mortality events • (Clark and Clark 2006, Ecological Archives)
The La Selva Biological Station (Organization for Tropical Studies) • in Costa Rica’s Caribbean lowlands (10o26'N, 84o00'W; 37-150 m elev.;1510 ha) • tropical wet forest • mean annual rainfall • 3.9 m (> 4 yards) Slide from D. and D. Clark
Cecropia obtusifolia, Cecropiaceae “Guarumo” Subcanopy Pioneer Max diam = 37 cm
Pentaclethra macroloba Fabaceae Canopy Max diam = 88 cm
Balizia elegans Fabaceae (Mimosoidae) Emergent Max diam = 150 cm
Lecythis ampla Lecythidaceae “Monkey Pot” Emergent Max diam = 161 cm
Dipteryx panamensis (Fabaceae:Papilionidae) Emergent tree ( light colored) Max diam = 187 cm
Species arranged from smallest to largest Look at the raw data: Linear relationship on a log scale Decrease in variance with size
Model development/parameterization • Regression of size(t+1) on size(t), by light • Regression of survival on size, by light • Integral projection model (IPM), by light • Markov chain of light dynamics • Megamatrix for age-from-stage analysis: transitions by light (5-6 categories) and size (300 size categories) Metcalf, Horvitz and Tuljapurkar, in prep. “A time to grow and a time to die: IPMs for ten tropical trees in a Markovian environment”
Growth as given by parameters of regression Growth increment peaks at intermediate sizes Interaction of size with initial light is complicated
Survival as given by parameters of logistic regression Survival peaks at fairly small sizes Survival lower in the dark Except PIONEERS
Tropical trees Growth and survival vary with size and depend upon light
Integral projection model Numerical estimation: Construct matrix We used one 300 x 300 matrix for each Light environment 300 size categories Integrates over size x at time t and projects to size y at time t+1, according to growth and survival functions, g(y, x) and s(x) Ellner and Rees 2006
Light environment dynamics: transitions in CI index by individual trees of each species Crown Illumination Index: Darkest = 1 --> Lightest = 5, 6
Model development/parameterization • Regression of survival on size, by light • Regression of size(t+1) on size(t), by light • Integral projection model (IPM), by light • Markov chain of light dynamics • Megamatrix for age-from-stage analysis: transitions by light (5-6 categories) and size (300 size categories) • Track expected transitions among stages and light environments for cohorts born into each light environment …
Highest juvenile Lowest intermediate age Plateau way below juvenile level Light matters EXCEPTIONS Pioneers, Pentaclethra Age, yrs
Rapid rise at small size • Peak ~ 5 cm Initial diam (mm)
First passage times (yrs) quicker when initial environment is lighter Size, mm 10 cm Forest inventory threshold 30 cm Diameter when canopy height is attained Max Diameter observed
First passage time to reach canopy vs initial size has a hump! Small plants may get there faster than somewhat larger plants Stage is different than age!
Cecropia spp Variance in growth highest for small plants
Initial Light Rapid growth associated with lower life expectancy Some species not expected to make it to canopy Initial light matters
Conclusions and results • Age-from-stage methods combined with IPM’s increase library of mortality trajectories • Pioneer, canopy and emergent tropical trees solve the light challenge differently • Single time step growth and survival peak at intermediate sizes • Mortality trajectories asymmetrically “bath tub”-shaped • Life expectancies ranged from 35 to > 500 yrs • Small plants may reach canopy sooner than large ones ! • Empirically-based stage structured demographic processes : a third perspective on death
Thanks, D. and D. Clark!!!! • National Institute on Aging, NIH, P01 AG022500-01 • Duke Population Research Center • John C. Gifford Arboretum at the University of Miami • Jim Carey, Jim Vaupel And also to Benjamin Gompertz [that we may not quickly] “…lose [our] remaining power to oppose destruction…”
Thanks! • Deborah Clark, David Clark
A is population projection matrixF is reproductiondeath is an absorbing state
Q’s and S’s in a variable environment At each age, A(x) is one of {A1, A2, A3…Ak} and Q(x) is one of {Q1, Q2, Q3…Qk} and S(x) is one of {S1, S2, S3…SK} Stage-specific one-period survival
Cohort dynamicswith stage structure, variable environment Individuals are born into stage 1 N(0) = [1, 0, … ,0]’ As the cohort ages, its dynamics are given by N(x+1) = X (t) N (x), X is a random variable that takes on values Q1, Q2,…,QK
Cohort dynamicswith stage structure As the cohort ages, it spreads out into different stages and at each age x, we track l(x) = ΣN(x) survivorship of cohort U(x) = N(x)/l(x) stage structure of cohort
Mortality from weighted average of one-period survivals one period survival of cohort at age x = stage-specific survivals weighted by stage structure l(x+1)/l(x) = < Z (t), U(x) > Z is a random variable that takes on values S1, S2,…,SK Mortality rate at age x μ(x) = - log [ l(x+1)/l(x) ]