Download
1 / 1
10 likes | 115 Views
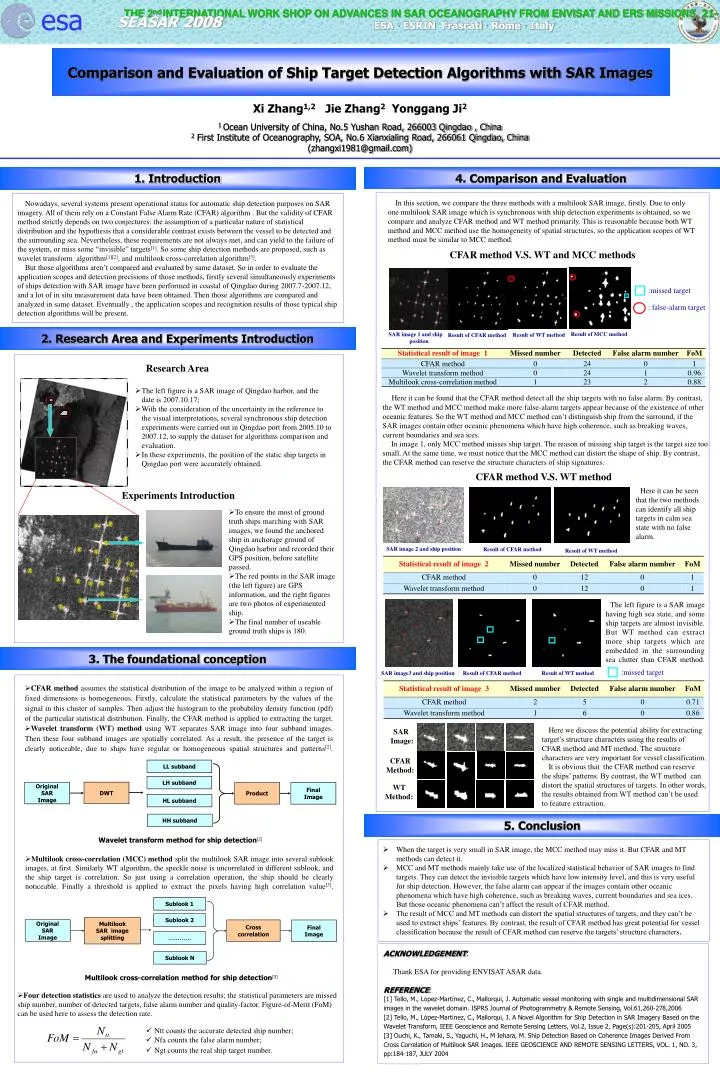
:missed target. : false-alarm target. Statistical result of image 1. Missed number. Detected. False alarm number. FoM. CFAR method. 0. 24. 0. 1. Wavelet transform method. 0. 24. 1. 0.96. Multilook cross-correlation method. 1. 23. 2. 0.88. SAR image 2 and ship position.

E N D
:missed target : false-alarm target Statistical result of image 1 Missed number Detected False alarm number FoM CFAR method 0 24 0 1 Wavelet transform method 0 24 1 0.96 Multilook cross-correlation method 1 23 2 0.88 SAR image 2 and ship position Result of WT method Result of CFAR method Statistical result of image 2 Missed number Detected False alarm number FoM CFAR method 0 12 0 1 Wavelet transform method 0 12 0 1 :missed target SAR image3 and ship position Result of CFAR method Result of WT method Statistical result of image 3 Missed number Detected False alarm number FoM CFAR method 2 5 0 0.71 Wavelet transform method 1 6 0 0.86 SAR Image: CFAR Method: WT Method: esa THE 2nd INTERNATIONAL WORK SHOP ON ADVANCES IN SAR OCEANOGRAPHY FROM ENVISAT AND ERS MISSIONS 21-25 January 2008 ESA · ESRIN Frascati · Rome · Italy SEASAR 2008 Comparison and Evaluation of Ship Target Detection Algorithms with SAR Images Xi Zhang1,2 Jie Zhang2 Yonggang Ji2 1 Ocean University of China, No.5 Yushan Road, 266003 Qingdao , China 2 First Institute of Oceanography, SOA, No.6 Xianxialing Road, 266061 Qingdao, China (zhangxi1981@gmail.com) 4. Comparison and Evaluation 1. Introduction In this section, we compare the three methods with a multilook SAR image, firstly. Due to only one multilook SAR image which is synchronous with ship detection experiments is obtained, so we compare and analyze CFAR method and WT method primarily. This is reasonable because both WT method and MCC method use the homogeneity of spatial structures, so the application scopes of WT method must be similar to MCC method. Nowadays, several systems present operational status for automatic ship detection purposes on SAR imagery. All of them rely on a Constant False Alarm Rate (CFAR) algorithm . But the validity of CFAR method strictly depends on two conjectures: the assumption of a particular nature of statistical distribution and the hypothesis that a considerable contrast exists between the vessel to be detected and the surrounding sea. Nevertheless, these requirements are not always met, and can yield to the failure of the system, or miss some “invisible” targets[1]. So some ship detection methods are proposed, such as wavelet transform algorithm[1][2], and multilook cross-correlation algorithm[3]. But those algorithms aren’t compared and evaluated by same dataset. So in order to evaluate the application scopes and detection precisions of those methods, firstly several simultaneously experiments of ships detection with SAR image have been performed in coastal of Qingdao during 2007.7-2007.12, and a lot of in situ measurement data have been obtained. Then those algorithms are compared and analyzed in same dataset. Eventually , the application scopes and recognition results of those typical ship detection algorithms will be present. CFAR method V.S. WT and MCC methods 2. Research Area and Experiments Introduction Result of MCC method SAR image 1 and ship position Result of WT method Result of CFAR method Research Area • The left figure is a SAR image of Qingdao harbor, and the date is 2007.10.17; • With the consideration of the uncertainty in the reference to the visual interpretations, several synchronous ship detection experiments were carried out in Qingdao port from 2005.10 to 2007.12, to supply the dataset for algorithms comparison and evaluation. • In these experiments, the position of the static ship targets in Qingdao port were accurately obtained. Here it can be found that the CFAR method detect all the ship targets with no false alarm. By contrast, the WT method and MCC method make more false-alarm targets appear because of the existence of other oceanic features. So the WT method and MCC method can’t distinguish ship from the surround, if the SAR images contain other oceanic phenomena which have high coherence, such as breaking waves, current boundaries and sea ices. In image 1, only MCC method misses ship target. The reason of missing ship target is the target size too small. At the same time, we must notice that the MCC method can distort the shape of ship. By contrast, the CFAR method can reserve the structure characters of ship signatures. CFAR method V.S. WT method Experiments Introduction Here it can be seen that the two methods can identify all ship targets in calm sea state with no false alarm. • To ensure the most of ground truth ships marching with SAR images, we found the anchored ship in anchorage ground of Qingdao harbor and recorded their GPS position, before satellite passed. • The red points in the SAR image (the left figure) are GPS information, and the right figures are two photos of experimented ship. • The final number of useable ground truth ships is 180. The left figure is a SAR image having high sea state, and some ship targets are almost invisible. But WT method can extract more ship targets which are embedded in the surrounding sea clutter than CFAR method. 3. The foundational conception • CFAR method assumes the statistical distribution of the image to be analyzed within a region of fixed dimensions is homogeneous. Firstly, calculate the statistical parameters by the values of the signal in this cluster of samples. Then adjust the histogram to the probability density function (pdf) of the particular statistical distribution. Finally, the CFAR method is applied to extracting the target. • Wavelet transform (WT) method using WT separates SAR image into four subband images. Then these four subband images are spatially correlated. As a result, the presence of the target is clearly noticeable, due to ships have regular or homogeneous spatial structures and patterns[2]. Here we discuss the potential ability for extracting target’s structure characters using the results of CFAR method and MT method. The structure characters are very important for vessel classification. It is obvious that the CFAR method can reserve the ships’ patterns. By contrast, the WT method can distort the spatial structures of targets. In other words, the results obtained from WT method can’t be used to feature extraction. LL subband LH subband DWT Original SAR Image Product Final Image HL subband HH subband 5. Conclusion Wavelet transform method for ship detection[2] • When the target is very small in SAR image, the MCC method may miss it. But CFAR and MT methods can detect it. • MCC and MT methods mainly take use of the localized statistical behavior of SAR images to find targets. They can detect the invisible targets which have low intensity level, and this is very useful for ship detection. However, the false alarm can appear if the images contain other oceanic phenomena which have high coherence, such as breaking waves, current boundaries and sea ices. But those oceanic phenomena can’t affect the result of CFAR method. • The result of MCC and MT methods can distort the spatial structures of targets, and they can’t be used to extract ships’ features. By contrast, the result of CFAR method has great potential for vessel classification because the result of CFAR method can reserve the targets’ structure characters. • Multilook cross-correlation (MCC) method split the multilook SAR image into several sublook images, at first. Similarly WT algorithm, the speckle noise is uncorrelated in different sublook, and the ship target is correlation. So just using a correlation operation, the ship should be clearly noticeable. Finally a threshold is applied to extract the pixels having high correlation value[3]. Sublook 1 Sublook 2 Multilook SAR image splitting Original SAR Image Cross correlation Final Image ………… ACKNOWLEDGEMENT: Thank ESA for providing ENVISAT ASAR data. REFERENCE: [1] Tello, M., López-Martínez, C., Mallorqui, J.Automatic vessel monitoring with single and multidimensional SAR images in the wavelet domain. ISPRS Journal of Photogrammetry & Remote Sensing, Vol.61,260-278,2006 [2] Tello, M., López-Martínez, C., Mallorqui, J. A Novel Algorithm for Ship Detection in SAR Imagery Based on the Wavelet Transform, IEEE Geoscience and Remote Sensing Letters, Vol.2, Issue 2, Page(s):201-205, April 2005 [3] Ouchi, K., Tamaki, S., Yaguchi, H., M Iehara, M. Ship Detection Based on Coherence Images Derived From Cross Correlation of Multilook SAR Images. IEEE GEOSCIENCE AND REMOTE SENSING LETTERS, VOL. 1, NO. 3, pp:184-187, JULY 2004 Sublook N Multilook cross-correlation method for ship detection[3] • Four detection statistics are used to analyze the detection results; the statistical parameters are missed ship number, number of detected targets, false alarm number and quality-factor. Figure-of-Merit (FoM) can be used here to assess the detection rate. • Ntt counts the accurate detected ship number; • Nfa counts the false alarm number; • Ngt counts the real ship target number.