Download
1 / 16
160 likes | 272 Views
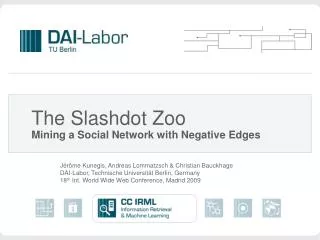
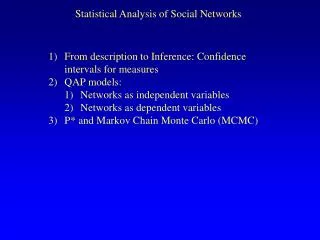
Statistical Analysis of the Social Network and Discussion Threads in Slashdot. Vicenç Gómez, Andreas Kaltenbrunner, Vicente López Defended by: Alok Rakkhit. Goals. Understand underlying pattern of communication Lead towards efficient techniques to improve system performance

E N D
Statistical Analysis of the Social Network and DiscussionThreads in Slashdot Vicenç Gómez, Andreas Kaltenbrunner, Vicente López Defended by: Alok Rakkhit
Goals • Understand underlying pattern of communication • Lead towards efficient techniques to improve system performance • Evaluate Controversy of a thread
Why Slashdot? • Community-based moderation of message boards • Scoring system • Thread comments mainly respond to each other rather than to article • Same dataset as previous studies (characterizing its size and lifespan)
Network Structure • Filtered out • Original Poster (if no other involvement) • Self-replies • Anonymous posts • -1 scores • Topology created in 3 ways • Undirected Dense • Undirected Sparse • Directed
Network Structure - Expected Features • One giant cluster containing vast majority of users • Isolated clusters of two to four • Two orders of magnitude above random • Small path lengths • Small maximum distance
Degree Analysis • High variance • Degree coefficient very small • Major diff from traditional social networks • Moderate reciprocity • Tail of distribution not authors of posts • Truncated Log-Normal (LN) hypothesis formed much better approximation than Power-Law hypothesis
Effects of Score • Calculated mean score of users with at least 10 posts • Found two classes of writers: good and average • Good writers • Bias in number of comments received • More replies to their poorly scored posts than those of average users
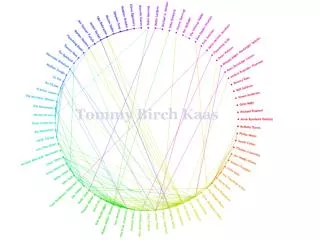
Community Structure: • Most pairs have few comments • Few have very high, up to 108 • Good writers form backbone of network.
Discussion structure: • Radial tree representation used • High heterogeneity in shape • Similar mechanism behind their evolution • Broad first level, wider second level, followed by exponential decay • Decay due to accessibility, new articles • Branching for level 0 bell shaped, others have continuous decrease (LN fit)
Evaluating Controversy • Little work done in area • Other available method involves training a classifier for semantic and structural analysis • Propose using an h-index • modified from paper output of researchers • Simple, based of structure alone • Factors both number of comments and maximum depth • Tie breaker to thread with fewer comments
Impact • Cited by 11 papers • Automatic scoring of posts • Predicting popularity of online content • What makes conversations interesting • Comparing volume vs. interaction