Download
1 / 1
10 likes | 16 Views
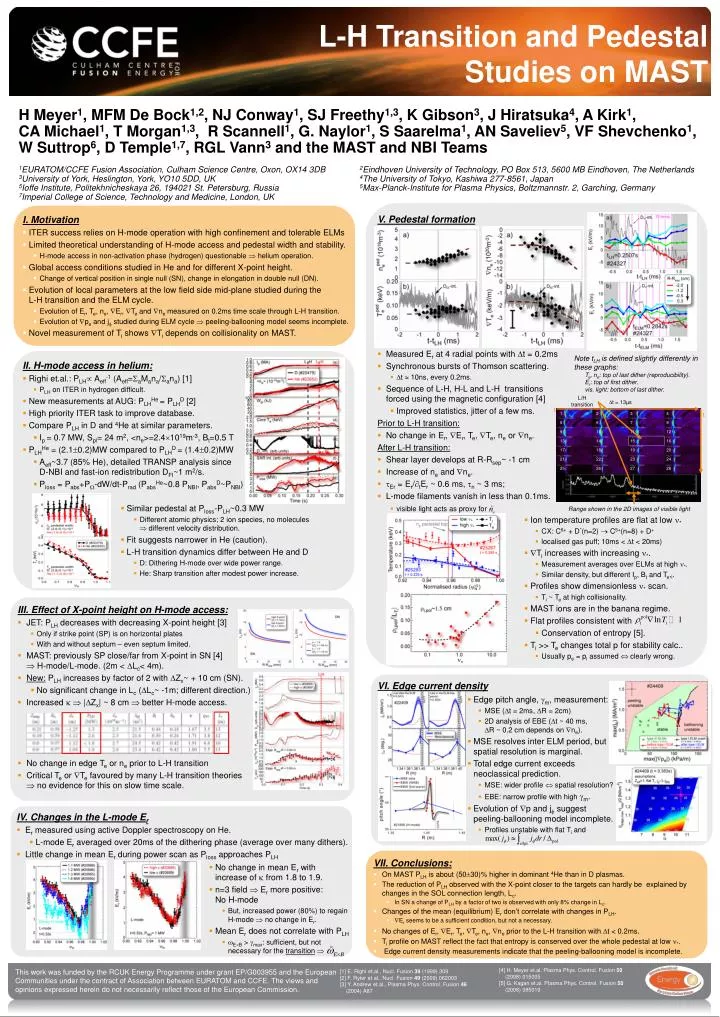
L/H transition. t = 13 µs. t. 1 2 3 4 5 6 7 8 9 10 11 12 13 14 15 16 17 18 19 20 21 22 23 24 25 26 27 28. t. Range shown in the 2D images of visible light. Ion temperature profiles are flat at low * CX: C 6+ + D * (n=2) C 5+ (n=8) + D + localised gas puff; 10ms < t < 20ms)

E N D
L/H transition t = 13µs t 1 2 3 4 5 6 7 8 9 10 11 12 13 14 15 16 17 18 19 20 21 22 23 24 25 26 27 28 t Range shown in the 2D images of visible light • Ion temperature profiles are flat at low * • CX: C6+ + D*(n=2) C5+(n=8) + D+ • localised gas puff; 10ms < t < 20ms) • Ti increases with increasing *. • Measurement averages over ELMs at high *. • Similar density, but different Ip, Bt and Te,i. • Profiles show dimensionless * scan. • Ti ~ Te at high collisionality. • MAST ions are in the banana regime. • Flat profiles consistent with • Conservation of entropy [5]. • Ti >> Te changes total p for stability calc.. • Usually pe = pi assumed clearly wrong. • Edge pitch angle, m, measurement: • MSE (t = 2ms, R = 2cm) • 2D analysis of EBE (t ~ 40 ms, R ~ 0.2 cm depends on ne). • MSE resolves inter ELM period, but spatial resolution is marginal. • Total edge current exceeds neoclassical prediction. • MSE: wider profile spatial resolution? • EBE: narrow profile with high m. • Evolution of p and j suggest peeling-ballooning model incomplete. • Profiles unstable with flat Ti and L-H Transition and Pedestal Studies on MAST H Meyer1, MFM De Bock1,2, NJ Conway1, SJ Freethy1,3, K Gibson3, J Hiratsuka4, A Kirk1, CA Michael1, T Morgan1,3, R Scannell1, G. Naylor1, S Saarelma1, AN Saveliev5, VF Shevchenko1, W Suttrop6, D Temple1,7, RGL Vann3 and the MAST and NBI Teams 1EURATOM/CCFE Fusion Association, Culham Science Centre, Oxon, OX14 3DB 2Eindhoven University of Technology, PO Box 513, 5600 MB Eindhoven, The Netherlands 3University of York, Heslington, York, YO10 5DD, UK 4The University of Tokyo, Kashiwa 277-8561, Japan 5Ioffe Institute, Politekhnicheskaya 26, 194021 St. Petersburg, Russia 5Max-Planck-Institute for Plasma Physics, Boltzmannstr. 2, Garching, Germany 7Imperial College of Science, Technology and Medicine, London, UK V. Pedestal formation • Measured Er at 4 radial points with t = 0.2ms • Synchronous bursts of Thomson scattering. • t 10ns, every 0.2ms. • Sequence of L-H, H-L and L-H transitions forced using the magnetic configuration [4] • Improved statistics, jitter of a few ms. Prior to L-H transition: • No change in Er, Er, Te, Te, ne or ne. After L-H transition: • Shear layer develops at R-Rsep~ -1 cm • Increase of ne and ne. • Er = Er/tEr ~ 0.6 ms, n ~ 3 ms; • L-mode filaments vanish in less than 0.1ms. • visible light acts as proxy for I. Motivation • ITER success relies on H-mode operation with high confinement and tolerable ELMs • Limited theoretical understanding of H-mode access and pedestal width and stability. • H-mode access in non-activation phase (hydrogen) questionable helium operation. • Global access conditions studied in He and for different X-point height. • Change of vertical position in single null (SN), change in elongation in double null (DN). • Evolution of local parameters at the low field side mid-plane studied during the L-H transition and the ELM cycle. • Evolution of Er, Te, ne, Er, Te and ne measured on 0.2ms time scale through L-H transition. • Evolution of pe and j studied during ELM cycle peeling-ballooning model seems incomplete. • Novel measurement of Ti shows Ti depends on collisionality on MAST. II. H-mode access in helium: • Righi et.al.: PLH Aeff-1 (Aeff=aMana/ana) [1] • PLH on ITER in hydrogen difficult. • New measurements at AUG: PLHHe = PLHD [2] • High priority ITER task to improve database. • Compare PLH in D and 4He at similar parameters. • Ip = 0.7 MW, Spl= 24 m2, <ne>=2.41019m-3, Bt=0.5 T • PLHHe = (2.10.2)MW compared to PLHD = (1.40.2)MW • Aeff~3.7 (85% He), detailed TRANSP analysis sinceD-NBI and fast-ion redistribution DFI~1 m2/s. • Ploss = Pabs+P-dW/dt-Prad (PabsHe~0.8 PNBI, PabsD~PNBI) Note tLH is defined slightly differently in these graphs: Te, ne: top of last dither (reproducibility). Er: top of first dither. vis. light: bottom of last dither. • Similar pedestal at Ploss-PLH~0.3 MW • Different atomic physics; 2 ion species, no molecules different velocity distribution. • Fit suggests narrower in He (caution). • L-H transition dynamics differ between He and D • D: Dithering H-mode over wide power range. • He: Sharp transition after modest power increase. III. Effect of X-point height on H-mode access: • JET: PLH decreases with decreasing X-point height [3] • Only if strike point (SP) is on horizontal plates • With and without septum – even septum limited. • MAST: previously SP close/far from X-point in SN [4] H-mode/L-mode. (2m < Lc< 4m). • New: PLH increases by factor of 2 with Zx~ + 10 cm (SN). • No significant change in Lc (Lc~ -1m; different direction.) • Increased |Zx| ~ 8 cm better H-mode access. • No change in edge Te or ne prior to L-H transition • Critical Te or Te favoured by many L-H transition theories no evidence for this on slow time scale. VI. Edge current density IV. Changes in the L-mode Er • Er measured using active Doppler spectroscopy on He. • L-mode Er averaged over 20ms of the dithering phase (average over many dithers). • Little change in mean Er during power scan as Ploss approaches PLH VII. Conclusions: • On MAST PLH is about (5030)% higher in dominant 4He than in D plasmas. • The reduction of PLH observed with the X-point closer to the targets can hardly be explained by changes in the SOL connection length, Lc. • In SN a change of PLH by a factor of two is observed with only 8% change in Lc. • Changes of the mean (equilibrium) Er don’t correlate with changes in PLH. • Er seems to be a sufficient condition, but not a necessary. • No changes of Er, Er, Te, Te, ne, ne prior to the L-H transition with t < 0.2ms. • Ti profile on MAST reflect the fact that entropy is conserved over the whole pedestal at low *. • Edge current density measurements indicate that the peeling-ballooning model is incomplete. • No change in mean Er with increase of from 1.8 to 1.9. • n=3 field Er more positive: No H-mode • But, increased power (80%) to regain H-mode no change in Er. • Mean Er does not correlate with PLH • EB > max: sufficient, but not necessary for the transition [4] H. Meyer et.al. Plasma Phys. Control. Fusion 50(2008) 015005 [5] G. Kagan et.al. Plasma Phys. Control. Fusion 50(2008) 085010 [1] E. Righi et.al., Nucl. Fusion 39 (1999) 309 [2] F. Ryter et.al., Nucl. Fusion 49 (2009) 062003 [3] Y. Andrew et.al., Plasma Phys. Control. Fusion 46(2004) A87