Download
1 / 45
450 likes | 582 Views
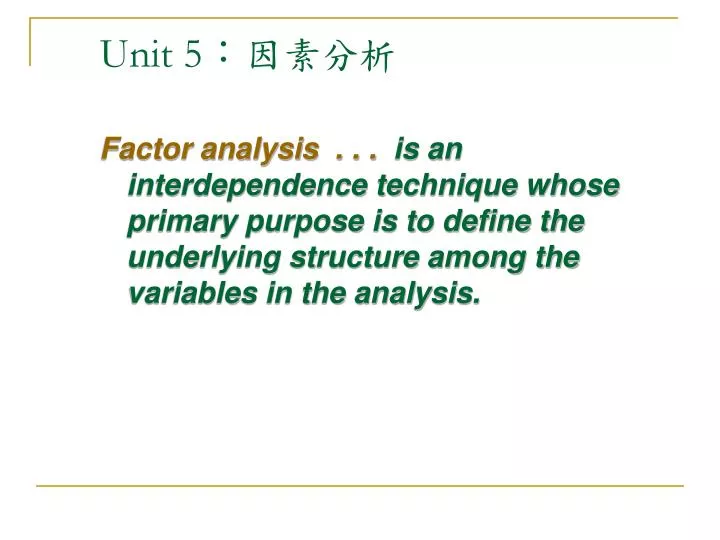
Unit 5 : 因素分析. Factor analysis . . . is an interdependence technique whose primary purpose is to define the underlying structure among the variables in the analysis. 5.1 範例說明 1. 行銷研究:生活型態因素之萃取 在行銷方面,消費品之行銷研究人員經常以生活型態因素為區隔變數,進行市場區隔。

E N D
Unit 5:因素分析 Factor analysis . . . is an interdependence technique whose primary purpose is to define the underlying structure among the variables in the analysis.
5.1 範例說明 1.行銷研究:生活型態因素之萃取 • 在行銷方面,消費品之行銷研究人員經常以生活型態因素為區隔變數,進行市場區隔。 • 生活型態係一抽象的構念,必須以不同的構面加以衡量。Plummer(1974)將生活型態分為三個構面,即活動(Activities) 、興趣(Interests) 、意見(Opinions)等,通稱為AIO量表。
生活型態又可分為一般化生活型態即特殊化生活型態兩類。生活型態又可分為一般化生活型態即特殊化生活型態兩類。 • 一般化生活型態: 指的是與產品無關的活動,如工作活動、休閒活動、宗教信仰、政治偏好、個人興趣…等。 • 特殊化生活型態: 指與產品相關的活動,有使用頻率、產品偏好、產品評價…等。
2.教育研究 • 在教育方面,因素分析可應用於學習能力因素之萃取,進而構建智商指標。 • 智慧商數之構建
3.財務研究 • 在財務方面,因素分析可應用於財務因素之萃取,以重點掌握公司的財務狀況。 • 放款策略與經營策略
5.2 方法說明 (1)基本概念 FA’s primary purpose is to define the underlying structure among the variables in the analysis. • Examines the interrelationships among a large number of variables and then attempts to explain them in terms of their common underlying dimensions. • These common underlying dimensions are referred to as factors. • Is a summarization and data reduction technique that does not have independent and dependent variables, but an interdependence technique in which all variables are considered simultaneously. 因素分析是一種互依分析技術,也是一類技術的統稱,包含許多縮減空間(或構面)的技術,其主要目的在以較少的維數(number of dimensions,即構面的數目)來表示原先的資料結構,而又能保存住原有資料結構所提供的大部份資訊。
(2)因素分析的用途: • 解開多變量資料中各變數間複雜的組合型式。 • 進行探索性的研究,以找出潛在的特徵,供未來實驗之用。 • 發展變數間的實證類型(empirical typologies)。 • 減少多變量資料的維數。 • 發展一種資料庫單維指數(data-based unidimensional index),俾便將受測者作差異最大化的區隔。 • 檢定某些變數間的假設關係。 • 將預測變數加以轉換,使其結構單純化後,再應用某些技術(如複迴歸或典型相關)來加以處理。 • 將知覺與偏好資料尺度化(scaling),並展現在一空間中。
(3) Factor analysis’s outcomes • Data summarization = derives underlying dimensions that, when interpreted and understood, describe the data in a much smaller number of concepts than the original individual variables. • Data reduction = extends the process of data summarization by deriving an empirical value (factor score) for each dimension (factor) and then substituting this value for the original values.
(4)因素分析假定樣本單位在某一變數上的反應(即觀察值或分數)是由二個部份所組成:(4)因素分析假定樣本單位在某一變數上的反應(即觀察值或分數)是由二個部份所組成: • 各變數共有的部份,稱為共同因素(common factor)。 • 各變數所獨有的部份,稱為獨特因素(unique factor),獨特因素與共同因素無關聯,與其他變數的獨特因素亦無關聯。
Extraction Method Determines the Types of Variance Carried into the Factor Matrix DiagonalValueVariance Unity (1) Communality Total Variance Common Specific and Error Variance extracted Variance not used
(4)設Zji為第i個樣本單位在第j個變數的分數,Fei為第i個樣本單位在第e個共同因素之分數,Uji為第i個樣本單位在第j個變數的獨特因素之分數。(4)設Zji為第i個樣本單位在第j個變數的分數,Fei為第i個樣本單位在第e個共同因素之分數,Uji為第i個樣本單位在第j個變數的獨特因素之分數。 令Z、F、U均為標準化之分數(即平均數為0,標準差為1),則第i個樣本單位在變數j的分數可用下式表示: Zji=aj1F1i+aj2F2i+…+ajkFki+djUji ajp是因素權重(factor weight),用以表示第p個共同因素對第j個變數之變異數的貢獻。 dj是指第j個變數之獨特因素的權重。
(5)σj2 = 1 = hj2+dj2 其中,σj2:變異數(variance) hj2:共同性(communality) dj2:獨特性(uniqueness或specificity) (6)主成分分析(Principal Component Analysis)假定各共同因素間彼此均無關聯,即相關係數為零,而且也不考慮變數分數中的獨特因素,故其變數分數(Zji)及共同性(hj2)分別為: Zji = aj1F1i+aj2F2i+…+ajkFki hj2 = aj12+aj22+…+ajk2 = 1
(7)負荷量 • 結構負荷量(structure loading): 各共同因素和變數間之相關係數。 • 組型負荷量(pattern loading): 又稱為因素權重,各共同因素之間相關係數為零時,結構負荷量等於因素上之組型負荷量。 • 因素負荷量(factor loading): 組型負荷量或結構負荷量一般均稱為因素負荷量。
5.3 處理流程 P230 圖9-1
5.4 理論探討 (1)共同因素之萃取 • 主要因素萃取法 探索性因素分析的因素萃取法主要有主軸法,驗證性因素分析的因素萃取法主要有最大概率法和多群體分析法。 1.主軸法 • 主軸法抽取因素的順序是以能對各變數之共同 性產生最大貢獻之因素優先抽取。
主軸法是目前在探索性因素分析中使用最多的因素抽取法。應用主軸法進行因素分析的模式很多,其中最常見的有主成份分析和主要因素法(Method of Principal Factor)。這兩個模式的主要差別在於共同性的估計方式不同。主成份分析是以1置入原相關係數矩陣之對角線上作為共同性之數值,而不對共同性另作估計。主要因素法不以1為共同性,而以最高相關係數法、反覆因素抽取法或複相關係數平方法等估計共同性,再以估計之共同性置入相關係數矩陣之對角線進行因素分析。
2.最大概率法 最大概率法不須先估計共同性,而是先假設共同因素之數目,而後依此假設導出因素和共同性。 3.多群體分析法 多群體分析法適用於驗證性研究。在進行這類因素分析時,研究人員事前已決定所有變數共含有多少個共同因素,以及那些變數歸屬於那個因素,研究人員再進行多群體因素抽取時,通常在一開始即將所有變數分成幾個群體,每群各歸屬於一個共同因素,然後按各變數所屬的群體,將整個相關係數矩陣分割為幾個小矩陣,以每個小矩陣之橫列和除以該小矩陣總和之平方根,以所得之商代表各該群體的「重心」(即因素)。
決定共同因素之數目 1.基本原則 抽取的因素愈少愈好,而抽取出之因素能解釋 各變數之變異數則愈大愈好。 2.常見方法 • 事先決定。參考理論架構及過去有關文獻來決 定抽取共同因素之數目。在驗證有關因素數目 的理論或假設時,可採用此種方法。 • 以特徵值(eigenvalue)大於1做為分野。
利用因素的陡階檢定(scree test)來決定。將 每一個因素所能解釋之變異數畫在同一圖形中, 將各點連線,把陡降後曲線走勢趨於平坦之因 素捨棄不用,相對而言,此類因素所能解釋的 變異數較小。 • 以變異數的百分比來決定。抽取出之因素所能 解釋的累積變異數已達某一預先設定的百分比 後就中止繼續抽取。 • 以各變數的共同性來決定。 • 利用平均變數(average variable)的解釋能力來決定。
(2)因素的轉軸與解釋 為了方便因素的解釋或命名,必須旋轉因素軸,以使各個因素的意義變得比較清晰明顯。 在因素分析中,研究者最關切的是各變數間的關係在因素空間中之型態。 旋轉因素座標軸並不會改變各變數間的關係型態,適當的旋轉因素軸反而能使此種型態更清楚地顯現出來。
轉軸的準則 1.因素矩陣的每一橫列裡,最少應有一個因素負 荷量為零。 2.如果有k個共同因素,則因素矩陣的每一直行中, 最少應有k個負荷量為零。 3.因素矩陣的任何兩個直行中,應該有幾個變數 在一個因素(即直行)上的負荷量為零,在另 一個因素上的負荷量則不為零。 4.當保留四個或以上的因素時,則在因素矩陣的 任何兩個直行中,大部份變數的負荷量應為零。 5.因素矩陣的任何兩個因素直行中,應該只有少 數幾個變數的負荷量不為零。
轉軸的方法 1.直交轉軸法: 各個因素之間均保持90度的關係,而因素與因素之間互相獨立。 --四方最大法(Quartimax) --變異數最大法(Varimax) 2.斜交轉軸法: --四方最小法(Quartimin) --共變數最小法(Covarimin) --雙四方最小法(Biquartimin)
Orthogonal Factor Rotation Unrotated Factor II +1.0 +.50 Rotated Factor II V1 V2 Unrotated Factor I -1.0 -.50 0 +.50 +1.0 V3 V4 -.50 -1.0 Rotated Factor I V5
Oblique Factor Rotation Unrotated Factor II Orthogonal Rotation: Factor II +1.0 +.50 Oblique Rotation: Factor II V1 V2 Unrotated Factor I -1.0 -.50 0 +.50 +1.0 V3 V4 Oblique Rotation: Factor I -.50 -1.0 V5 Orthogonal Rotation: Factor I
結果的解釋 1.因素與變數的關係可用三種方式表示: --因素權重(因素組型) --因素和變數之相關係數(因素結構) --因素和變數的部份相關(part correlation) 2.在直交轉軸後,因各因素間之相關為零,故此三者皆相同;在斜交轉軸後,三者之數值均不同,在解釋結果時,通常係以因素結構為主,由因素和變數間相關係數之大小,可以知道某個因素與那些變數具有較高的關聯,與那些變數有較小或沒有關聯,進而可了解該因素之意義,並賦予適當的名稱。
3.因素分析的用途有二項限制: • 因素分析最大限制為它是一高度主觀的分析過程。 • 在因素分析過程中,並無統計檢定方法可供有規律的使用。
Rules of Thumb 1 • Factor Analysis Design • Factor analysis is performed most often only on metric variables, although specialized methods exist for the use of dummy variables. A small number of “dummy variables” can be included in a set of metric variables that are factor analyzed. • If a study is being designed to reveal factor structure, strive to have at least five variables for each proposed factor. • For sample size: • the sample must have more observations than variables. • the minimum absolute sample size should be 50 observations. • Maximize the number of observations per variable, with a minimum of five and hopefully at least ten observations per variable.
Rules of Thumb 2 • Testing Assumptions of Factor Analysis • There must be a strong conceptual foundation to support the assumption that a structure does exist before the factor analysis is performed. • A statistically significant Bartlett’s test of sphericity (sig. > .05) indicates that sufficient correlations exist among the variables to proceed. • Measure of Sampling Adequacy (MSA) values must exceed .50 for both the overall test and each individual variable. Variables with values less than .50 should be omitted from the factor analysis one at a time, with the smallest one being omitted each time.
Rules of Thumb 3 • Choosing Factor Models and Number of Factors • Although both component and common factor analysis models yield similar results in common research settings (30 or more variables or communalities of .60 for most variables): • the component analysis model is most appropriate when data reduction is paramount. • the common factor model is best in well-specified theoretical applications. • Any decision on the number of factors to be retained should be based on several considerations: • use of several stopping criteria to determine the initial number of factors to retain. • Factors With Eigenvalues greater than 1.0. • A pre-determined number of factors based on research objectives and/or prior research. • Enough factors to meet a specified percentage of variance explained, usually 60% or higher. • Factors shown by the scree test to have substantial amounts of common variance (i.e., factors before inflection point). • More factors when there is heterogeneity among sample subgroups. • Consideration of several alternative solutions (one more and one less factor than the initial solution) to ensure the best structure is identified.
Rules of Thumb 4 • Choosing Factor Rotation Methods • Orthogonal rotation methods: • are the most widely used rotational methods. • are The preferred method when the research goal is data reduction to either a smaller number of variables or a set of uncorrelated measures for subsequent use in other multivariate techniques. • Oblique rotation methods: • best suited to the goal of obtaining several theoretically meaningful factors or constructs because, realistically, very few constructs in the “real world” are uncorrelated.
Guidelines for Identifying Significant Factor Loadings Based on Sample Size Factor Loading Sample Size Needed for Significance* .30 350 .35 250 .40 200 .45 150 .50 120 .55 100 .60 85 .65 70 .70 60 .75 50 *Significance is based on a .05 significance level (a), a power level of 80 percent, and standard errors assumed to be twice those of conventional correlation coefficients.
Rules of Thumb 5 • Assessing Factor Loadings • While factor loadings of +.30 to +.40 are minimally acceptable, values greater than + .50 are considered necessary for practical significance. • To be considered significant: • A smaller loading is needed given either a larger sample size, or a larger number of variables being analyzed. • A larger loading is needed given a factor solution with a larger number of factors, especially in evaluating the loadings on later factors. • Statistical tests of significance for factor loadings are generally very conservative and should be considered only as starting points needed for including a variable for further consideration.
Rules of Thumb 6 • Interpreting The Factors • An optimal structure exists when all variables have high loadings only on a single factor. • Variables that cross-load (load highly on two or more factors) are usually deleted unless theoretically justified or the objective is strictly data reduction. • Variables should generally have communalities of greater than .50 to be retained in the analysis. • Respecification of a factor analysis can include options such as: • deleting a variable(s), • changing rotation methods, and/or • increasing or decreasing the number of factors.
Rules of Thumb 7 • Summated Scales • A summated scale is only as good as the items used to represent the construct. While it may pass all empirical tests, it is useless without theoretical justification. • Never create a summated scale without first assessing its unidimensionality with exploratory or confirmatory factor analysis. • Once a scale is deemed unidimensional, its reliability score, as easured by Cronbach’s alpha: • should exceed a threshold of .70, although a .60 level can be used in exploratory research. • the threshold should be raised as the number of items increases, especially as the number of items approaches 10 or more. • With reliability established, validity should be assessed in terms of: • convergent validity = scale correlates with other like scales. • discriminant validity = scale is sufficiently different from other related scales. • nomological validity = scale “predicts” as theoretically suggested.
Rules of Thumb 8 • Representing Factor Analysis In Other Analyses • The single surrogate variable: • Advantages: simple to administer and interpret. • Disadvantages: • does not represent all “facets” of a factor • prone to measurement error. • Factor scores: • Advantages: • represents all variables loading on the factor, • best method for complete data reduction. • Are by default orthogonal and can avoid complications caused by multicollinearity. • Disadvantages: • interpretation more difficult since all variables contribute through loadings • Difficult to replicate across studies.
Representing Factor Analysis In Other Analyses • Summated scales: • Advantages: • compromise between the surrogate variable and factor score options. • reduces measurement error. • represents multiple facets of a concept. • easily replicated across studies. • Disadvantages: • includes only the variables that load highly on the factor and excludes those having little or marginal impact. • not necessarily orthogonal. • Require extensive analysis of reliability and validity issues.
Rotated Component Matrix “Reduced Set” of HBAT Perceptions Variables Component Communality 1 2 3 4 X9 – Complaint Resolution .933 .890 X18 – Delivery Speed .931 .894 X16 – Order & Billing .886 .806 X12 – Salesforce Image .898 .860 X7 – E-Commerce Activities .868 .780 X10 – Advertising .743 .585 X8 – Technical Support .940 .894 X14 – Warranty & Claims .933 .891 X6 – Product Quality .892 .798 X13 – Competitive Pricing -.730 .661 Sum of Squares 2.589 2.216 1.846 1.406 8.057 Percentage of Trace 25.893 22.161 18.457 14.061 80.572 Extraction Method: Principal Component Analysis. Rotation Method: Varimax.