Download
1 / 22
220 likes | 813 Views
Paleoclimate indicators. Rock types as indicators of climate. Accumulation of significant thicknesses of limestone and Reef-bearing limestone is restricted to ~20º + - equator. Gowganda tillite, Ontario. Rock record of glaciation, this one ~2.3 billion years ago!.

E N D
Accumulation of significant thicknesses of limestone and Reef-bearing limestone is restricted to ~20º + - equator
Gowganda tillite, Ontario Rock record of glaciation, this one ~2.3 billion years ago!
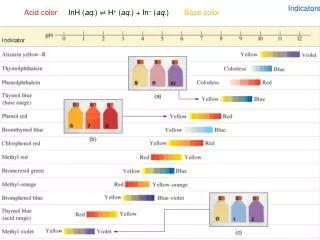
The concept of climate proxies • A climate proxy is something that records or reflects a change in temp or rainfall but does not DIRECTLY measure temperature or precipitation For example…
Serrations on leaf margins indicate temperature: jagged edges indicate cooler climate Leaf waxiness is an indicator of moisture retention
Tree rings:degree of seasonality In the tropics there is no difference in growing seasons and tree rings are not well developed. These are tree rings from a tree in a temperate climate
Vegetation zones in Europe parallel latitude now and 9,000 yr before present
Middle Cretaceous climate indicators W = warm- water animal occurrences; E = evaporite minerals; C = coal deposits. Coal is not particularly temp sensitive but animals and evaporation are.
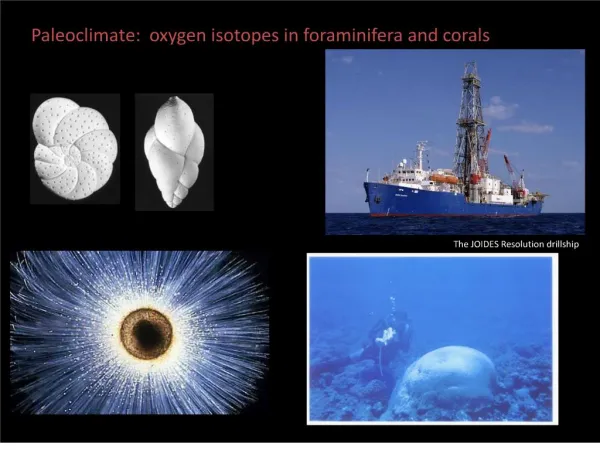
Stable isotopes of oxygen: a proxy for temperature but now considered an almost direct measurement • Stable isotopes: do not decay over time. Ex, O16 and O18. O18 is produced from O16 through nucleosynthesis in supernovae Anything that incorporates oxygen into its chemical structure will do so with some ratio of O18:O16. We can measure the ratios of these isotopes in the lab
O18/O16 fractionation H2O is evaporated from sea water. The oxygen in the H2O is enriched in the lighter O16. This H2O condenses in clouds,falling on land as precipitation. Thus, H2O that is part of the terrestrial water cycle is enriched in the light O16 isotope and sea water is enriched in the heavier O18 isotope
Glacial ice is therefore made up primarily of water with the light O16 isotope. This leave the oceans enriched in the heavier O18, or “more positive.” During glacial periods, more O16 is trapped in glacial ice and the oceans become even more enriched in O18. During interglacial periods, O16 melts out of ice and the oceans become less O18 rich, or “more negative” in O18
If we collect a shell made out of CaCO3, we can analyze the O18:O16 ratio by the following formula: delta O18= [(O18/O16 sample/O18/O16 standard) -1 ] x1000 The standard that your sample is compared to is either one prepared from ocean water or from a fossil standard. Positive delta O18 values mean that your sample is enriched in the heavy O isotope; negative delta O18 values mean it’s depleted in the heavy O18.
Curve of average O18 isotope variation over the past 2my based on analysis of deep sea sediment The curve illustrates changes in global ice volume in successive glacial (blue) and interglacial (green) cycles of the Quaternary Period. Note that this graph does not show fluctuating temperatures, but changes in the dilution of sea water as a result of freshwater influx from melting glacial ice, i.e., this is a climate proxy
Sr87/Sr86a proxy for salinity/rainfall (evap vs ppt) During wet climates, more Sr is released from weathering minerals in granite
Middle Cretaceous and early Tertiary temperatures A reconstruction of changing atmospheric CO2 levels (blue) and resulting global temps (pink) over the past 100 my, based on analysis of climate proxies such as pollen, leaf serration, and O18 values. Note that the Mid-Late Cretaceous was significantly warmer than the early Tertiary (or today)
Not proxies, but direct measuresSr:Ca ratios in aragonite: a measure of seawater temperature Trace elements such as cadmium, barium, manganese and strontium replace Ca in the lattice of aragonite (a CaCO3 mineral). These trace elements often substitute for Ca as a result of climate-related variables. The following relationship between Sr:Ca ratios and temp was developed: Sr:Ca x 103 = 10.48 (=/- 0.01) - 0.0615 (+/- 0.0004) x temp. Thus we can measure trends in Sr:Ca ratios in coral aragonite skeletons as a way to determine surface sea water temps.
Ocean surface temps and climate in the Tertiary Surface temps measured in shell- bearing sediment from the western Pacific Ocean. Relatively warm surface waters from 49-35 M.a. are followed by a climate change to cooling and the buildup of glaciers. By 2.5 M.a. the onset of glaciation in the Northern hemisphere occurred, several M.a. after it started in Antarctica.
Although zonal, the zones can be compressed Zonal compression can result from changes in the movement of heat from the equator to poles
Take away points.. • What is a “climate proxy?” • What are examples of: geochemical proxies? biological proxies? lithologic proxies? When you see how paleoclimate reconstruction for a geologic period, can you describe the various techniques used to create it?