Download
1 / 17
170 likes | 279 Views
Energy Supply and Consumption Overview. Sources and Uses. The Global Energy Scene. Global energy production is about 480 QBtu/yr a QBtu is a quadrillion Btu, or 10 15 Btu so about 5 10 20 J per year (1 Btu is 1055 J) U.S. share is about one fifth of this (10 20 J)

E N D
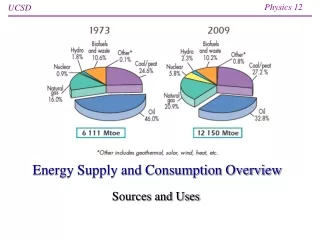
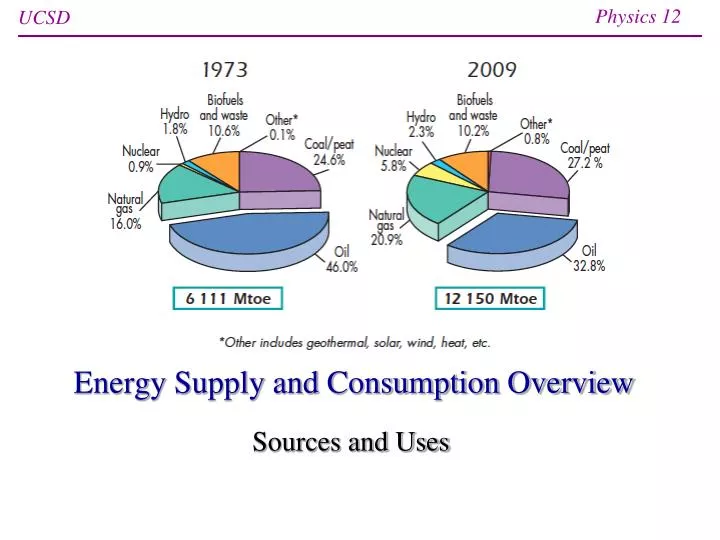
Energy Supply and Consumption Overview Sources and Uses
The Global Energy Scene • Global energy production is about 480 QBtu/yr • a QBtu is a quadrillion Btu, or 1015 Btu • so about 51020 J per year (1 Btu is 1055 J) • U.S. share is about one fifth of this (1020 J) • 1996 value in book (1st edition) is 93 QBtu/year • 2003 value in second edition is 98.3 QBtu/year • 2011 number from E.I.A. is 97.3 Qbtu/year (recession) • 1020 J/yr = 31012 W • divided by 300 million people (3108) = 104 W per person (10 kW)
Reminder: how do we stack up? world average = 10 bbl/yr
More Countries • Logarithmic scale • Fills in the gaps • 1971 data
The Fall of the Work Animal • Used to rely completely on animals for transportation • Trains entered the picture in the mid-1800s • Cars entered the scene in a big way around 1920 • World has never been the same • Work animal fell off the map around 1940 • Today automotive is over 95% of the story
Global Amounts and trends • Doubled energy use in 36 years: 2% growth • Mtoe is million tons oil equivalent: 1 toe is 39.7 MBtu • Fraction in fossil fuels went from 87% to 81% • still a fossil-dominated world: renewables are tiny graphic from IEA: Key World Energy Statistics
Evolution of Energy Sources 2.7% growth line in red
From Energy Information Agency Annual Energy Review, 2011 compare to Figure 1.5 in book (2003 numbers)
(U.S.) • Hydroelectric pretty tapped out • Biofuels and wind ascending, now at ~2% and 1%, resp. • “Other” contains geothermal, solar, and waste reprocessing • Dominant renewables are old technology
policy change U.S. Consumption vs. Production
Where is our energy produced, and of what flavor? based on 2003 data
Energy By Source and Sector, 2011 source EIA AER 2011, Section 2
Interpreting the Spider Web • The stacks themselves are straightforward • the left-hand stack you’ve already seen in other forms • The connecting lines indicate % use of each branch • for instance, 93% of transportation comes from petroleum, 3% from natural gas, 4% from renewables • meanwhile, 71% of energy from petroleum goes to transportation, 23% in industry, 5% directly in homes, 1% for electricity • Nuclear is all for electricity, and coal mostly so • almost half of electricity comes from coal • Petroleum is primarily for transportation • Natural gas is the most versatile, followed by renewables
Lessons • Our energy production is completely dominated by fossil fuels: 81% • nuclear and hydroelectric make up much of the balance • Part of our enormous appetite is due to the expanse of our country: transportation is important • Space heating is also an issue in a country where detached houses are the rule • Any industrial society (at our current scale) is going to have a large demand for energy
References & Assignments • Energy Information Agency Annual Energy Review • http://www.eia.gov/totalenergy/data/annual/index.cfm • International Energy Agency Key World Energy Statistics • http://www.iea.org/publications/freepublications/publication/name,31287,en.html • A recent amazing book: • Sustainable Energy—without the hot air, by David MacKay • www.withouthotair.com (get book for free!) • see 10-page synopsis for quick-read/intro • Another worthy book: ENERGY: A Guidebook, by Janet Ramage (more global perspective) • Assignments • Quiz #1 ready on TED, due by 11:59 PM tonight • Read Chapter 2 • Homework #2 to be found on the web: get an early start!