Download
1 / 40
400 likes | 490 Views
Using Neural Networks and Lagged Climate Indices to Predict Monthly Temperature and Precipitation Anomalies. Matthew Greenstein | METEO 485 | Apr. 26, 2004. Overview. To correlate monthly temperature and precipitation anomalies with a number of climate indices lagged several months

E N D
Using Neural Networks and Lagged Climate Indices to Predict Monthly Temperature and Precipitation Anomalies Matthew Greenstein|METEO 485|Apr. 26, 2004
Overview • To correlate monthly temperature and precipitation anomalies with a number of climate indices lagged several months • To use neural networks because they simulate non-linear interactions between variables(as opposed to linear regression)
Overview • Introduction to neural networks • Data collection • Temperature and precipitation anomalies • Climate indices • Methods of attack (“how to”) • Results • Discussion • Future ideas
Neural Networks • Creates categorical and numerical forecasts • Uses categorical and numerical predictors
Neural Networks • Layered regression equations • Predictors are linearly regressed (weighted) to create the hidden layer of intermediate forecasts • Hidden layer forecasts used as predictors to produce either another hidden layer (and so on) or a final forecast
Neural Networks • Layered regression captures non-linear relationships, i.e. mimics whatever equation best fits the data • You don’t need to know form of equation ahead of time • Each dot is a node • Human brain: 10 billion nodes • Neural net: 10 – 1000 nodes
Neural Networks • Training a network • Training data (66% of dataset) run through neural net / forecasts generated • Error calculated skill scores • Neural net tuned (weights changed) toimprove scores • Repeat fixed number of times (epochs) or until weights stop changing
Neural Networks Training a network Learning rate: how much weights are changed compared to error slope Momentum: use aportion of previousweight change forless “jumpiness”
Neural Networks Training a network Decay: eliminates useless weights / interactions
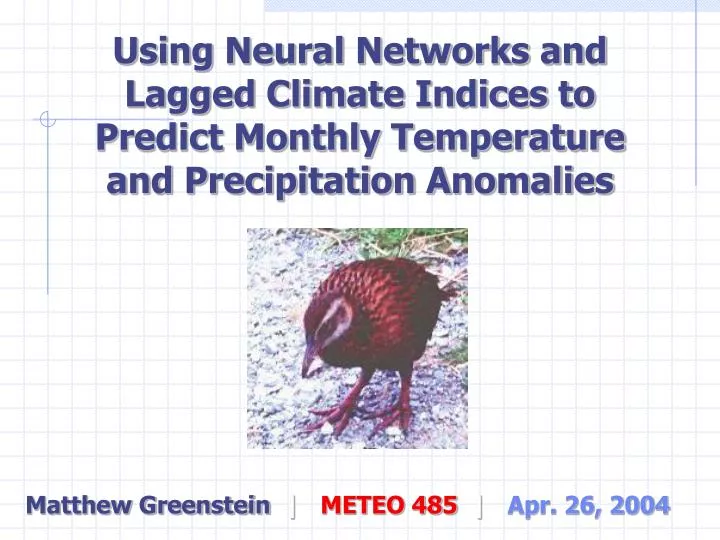
Neural Networks WEKA • Waikato Environment for Knowledge Analysis (University of Waikato, New Zealand) • Weka: flightless bird with an inquisitive nature found only in New Zealand • Set values oflearning rate, momentum,number of nodes, & epochsto fit data well without overfitting • Overfitting = fit too perfectly to training data performs poorly on new data
Data Collection What data is needed? • Monthly anomalies • 6 regions of the U.S. (NW, SW, NC, SC, NE, SE) • Temperature and precipitation • U.S. Climate Division data since 1895 available • Climate indices • Monthly values lagged 2, 3, & 4 months • Since 1948 available
Anomaly Data • Divide country into 6 pieces (NW/SW/NC/SC/NE/SE)
Anomaly Data • Obtained average monthly anomaly data for the U.S. Climate Divisions in each of the 6 regions • Dataset from Jeremy Ross • Averaged using GrADS • Monthly, 1950 – present • °F, inches
Climate Index Data • Obtained from CDC’s climate indices page: • http://www.cdc.noaa.gov/ClimateIndices/ • From 1950 – present • SOI, PNA, NAO, EPO, MEI, Nino3, Nino1+2, Nino3.4, Nino4, AO, NOI, WP, NP, QBO
Climate Index Data • Some years & months missing! • No SOI until 1951 • No AO until 1958 • No PNA for June & July • No EPO for Aug & Sept • WEKA throws out cases with missing data No forecasts were made for Aug – Jan !! • Need to re-run without PNA and EPO to get a neural net that can be used during any month
Data Processing • Excel file • Row for each month (Jan 1950 – Dec 2000) • Columns of month; each anomaly; andeach index lagged 2, 3, and 4 months
Data Processing • Conversion to ARFF / Attribute-Relation File Format • Save as a CSV • Fix blanks: ,, replaced by ,?, • Change file extension: .csv .arff
Method I • Following procedure followed for each anomaly • (NE T, NE P, SE T, SE P, SW T, SW P, NW T, NW P) • Build neural nets • Vary learning rate (L),momentum (M), layers,epochs • Decay • Indices and month predict anomaly • Takes a long time to try many possibilities
Method I • Skill scores • Calculated with remaining 34% of dataset • Many scores provided • 2 used • Correlation coefficient (r) • Root relative squared error • Relative to error if prediction = average of actual values • Outliers are penalized strongly
Results I • NE Temperature • Linear regression: r = 0.1067, RRSE = 102.25% • Neural nets:
Results I • SE Temperature • Linear regression: r = 0.0352, RRSE = 104.78% • Neural nets:
Results I • SW Temperature • Linear regression: r = 0.036, RRSE = 103.40% • Neural nets:
Results I • NW Temperature • Linear regression: r = 0.011, RRSE = 103.88% • Neural nets:
Results I • NE Precipitation • Linear regression: r = 0.073, RRSE = 101.044% • Neural nets:
Results I • SE Precipitation • Linear regression: r = 0.063, RRSE = 104.14% • Neural nets:
Results I • SW Precipitation • Linear regression: r = 0.187, RRSE = 98.83% • Neural nets:
Results I • NW Precipitation • Linear regression: r = 0.091, RRSE = 101.49% • Neural nets:
Results I • Putrid results !! • Not worth trying NC/SC… away from oceans • RRSE ~ 100%, r ~ 0.10 • No big improvement over linear regression • SW Precipitation predictedthe best (although still bad)…El Nino-related?
Method II • Predict positive or negative anomaly instead of actual value! • Anomalies changed to binary (1, 0) predictands • Vary indices used • Does that cause significant changes? • This became the most interesting part of the study • Limited time available: NE T, NE P, SW P
Method II • Skill scores • Many scores provided • 3 used • Percent Correctly Classified • TP (True Positive) Rate • TN (True Negative) Rate
Results II • NE Temperature Auto = WEKA automatically chooses node setup
Results II • NE Precipitation ** Changing the epochs results in overfitting!
Results II • SW Precipitation ** Changing the epochs did not change the ‘Only Nino: Nino 3.4” value
Discussion • NE Temperature94 +, 113 – • Predict negative correct 54.59% • Best neural net: 56.52% correctly classified • NE Precipitation110 +, 97 – • Predict positive correct 53.14% • Best neural net: 54.11 % correctly classified • SW Precipitation113 +, 94 – • Predict positive correct 54.59% • Best neural net: 62.32% correctly classified
Discussion • These types of neural nets do not provide significant skill over ‘guessing’ • Similar to Method I, not significant difference in skill of logistic regression versus neural nets • There is some sensitivity to which variables are included in the neural net… even though the decay factor would attempt to eliminate useless interactions • Different sensitivities in each region • Using the ‘auto’ setting for layers produced better results
Discussion • The study was originally supposed to predict the anomaly, but predicting the sign of the anomaly seems to show more promise • Time constraints prevented a more in depth look at Method II possible Meteo 485 project in future semesters • Missing June – Sept data could have caused problems with this study
Future Work • Obtain missing PNA & EPO data • Build neural nets for other regionsof the country for Method II • Use different lag times and combinations of lag times • Use different climate indices • Omit different indices from current set • Try other tools that WEKA offers
Special thanks to… • Jeremy Ross • For gathering anomaly data • Climate Diagnostics Center (CDC) • For climate indices • Dr. George Young • Neural net info from Meteo 474 notes
Useful Info • WEKA website with software downloads: http://www.cs.waikato.ac.nz/ml/weka/ • Results data file • ARFF file