Download
1 / 18
300 likes | 836 Views
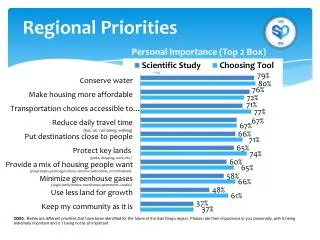
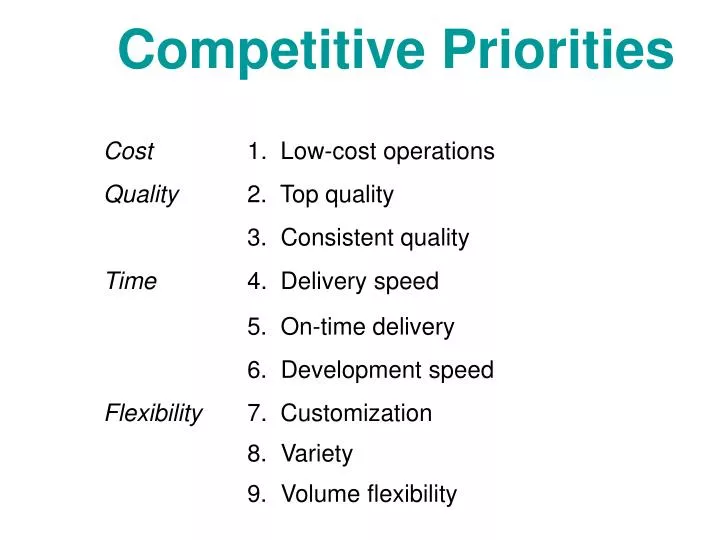
Competitive Priorities. Cost 1. Low-cost operations Quality 2. Top quality 3. Consistent quality Time 4. Delivery speed 5. On-time delivery 6. Development speed Flexibility 7. Customization 8. Variety 9. Volume flexibility . Strategic Gaps. PRIORITIES GAPS

E N D
Competitive Priorities Cost 1. Low-cost operations Quality 2. Top quality 3. Consistent quality Time 4. Delivery speed 5. On-time delivery 6. Development speed Flexibility 7. Customization 8. Variety 9. Volume flexibility
Strategic Gaps PRIORITIES GAPS 1. 2. 3. 4.
A Systematic Approach to Process Analysis Define Scope 2 Identify Opportunity 1 Document Process 3 Implement Changes 6 Redesign Process 5 Evaluate Performance 4
Less Customer Contact and Customization Service Package (1) (2) (3) High interaction with Some interaction with Low interaction with customers, highly customers, standard customers, standardized customized service services with some options services Process Characteristics (1) Jumbled flows, complex work with many exceptions (2) Flexible flows with some dominant paths, moderate job complexity with some exceptions (3) Line flows, routine work easily understood by employees Front office Hybrid office Less Complexity, Less Divergence, More Line Flows Back office Customer-Contact Model for Processes Figure 3.3
Less Customization and Higher Volume Product Design (1) (2) (3) (4) (5) One of a kind Low volume, Multiple Few major High volume products, made low products products, high to customer standardization moderate higher standardization, order volume volume commodity products Process Characteristics (1) Complex and highly customized process, unique sequence of tasks (2) Jumbled flows, complex work with many exceptions (3) Disconnected line flows, moderately complex work (4) Connected line, routine work (5) Continuous flows, highly repetitive work Project process Job process Less Complexity, Less Divergence, More Line Flows Batch process Line process Continuous process Product-Process Matrix for Processes Figure 3.6
Customer population Service system Waiting line Served customers Service facilities Priority rule Figure C.1 Waiting Line Models
Operating Characteristics • Line length • Number of customers in system • Waiting time in line • Total time in system • Service facility utilization
Decision Areas • Arrival rates • Number of service facilities • Number of phases • Number of servers per facility • Server efficiency • Priority rule • Service facility arrangement
Applying the Theory of Constraints 1. Identify the bottlenecks. 2. Optimize the schedule of the bottleneck. 3. Schedule all other resources to support the bottleneck. 4. If the bottleneck is still restrictive, increase its capacity. 5. Once the bottleneck has been relieved, check for other bottlenecks.
B1 20 D 10 A 15 C 20 B2 30 B3 15
How Can I Tell Which Markets Will Be Most Profitable? Contribution per hour c = contribution to profits and overhead per unit s = changeover time (hrs.) p = productivity rate (units per hour) T = total resource hours required for customer order = contribution per hour
E X T E R N A L C U S T O M E R S E X T E R N A L S U P P L I E R S External Value-Chain Linkages First-Tier Supplier Service/Product Provider Support Processes Support Processes Business- to- Business (B2B) Customer Relationship Process New Service/ Product Development Process Business-to-Customer (B2C) Customer Relationship Process New Service/ Product Development Process Supplier Relationship Process Order -Fulfillment Process Supplier RelationshipProcess Order -Fulfillment Process
Facial Tissue Variability Package Supplier K-C Customer Consumer
$2 million ($10 million)/(52 weeks) Weeks of supply = = 10.4 weeks $10 million $2 million Inventory turns = = 5 turns/year Inventory Measures Average inventory = $2 million Cost of goods sold = $10 million 52 business weeks per year Example 9.1
Efficient Supply Chains Environment Factors Responsive Supply Chains Design Factors Responsive Supply Chains Efficient Supply Chains Environments & Design Features
The Shaping of Modern Value Chains Ten Forces that Flattened the World • Berlin Wall and Windows Operating System • Web Browsers • Work Flow Software • Open Sourcing • Outsourcing 6. Offshoring 7. Supply Chaining 8. In-Sourcing 9. In-Forming 10. The Steroids