Download
1 / 17
180 likes | 297 Views
The Future of Twin Cities Transportation Policy. November 28, 2007. A number of factors are converging to exacerbate congestion in the metro area. The Met Council predicts that the seven county metro area will continue to grow in the next 20 years

E N D
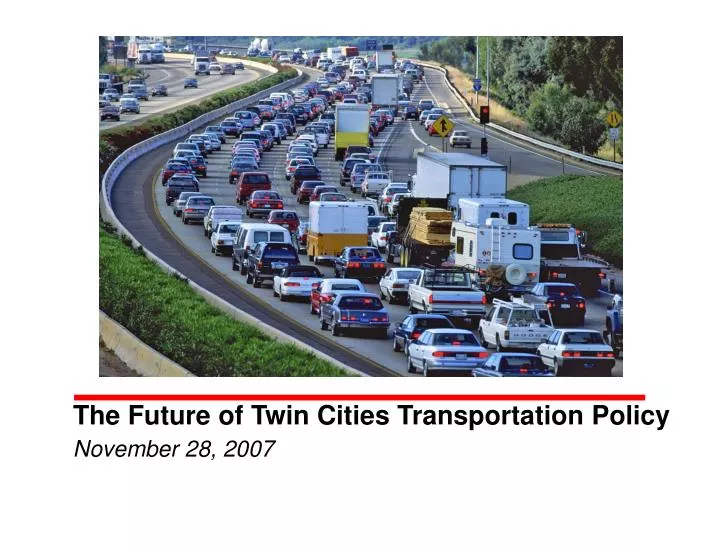
The Future of Twin Cities Transportation Policy November 28, 2007
A number of factors are converging to exacerbate congestion in the metro area. • The Met Council predicts that the seven county metro area will continue to grow in the next 20 years • Add over 1 million people and 470 thousand households • Add nearly 500 thousand new jobs and generate 4 million additional daily trips • Automobile ownership has increased significantly since 1970 • From 1/3 of homes with two cars to nearly 2/3 with new cars since 1970 • On average, there is slightly more than one car for every licensed driver in MN • Road usage, as measured by vehicle miles traveled (VMT) is expected to grow 51% by 2030. • 93% of all daily trips are motorized • Nearly 80% of urban interstates are already congested • Over 2,530 lane miles are needed to eliminate severe congestion by 2030, almost all in the metro • Minnesotans continue to become more mobile, yet demand far outpaces supply of roads • Households living outside Minneapolis/St. Paul have increased from 54% to 73% since 1970 • Jobs outside Minneapolis/St. Paul have increased from 44% to 69% in same period • Lane miles of freeway construction have declined significantly in the past 35 years • Only 151 miles added in the 1990’s; only 29 miles from 2004 to 2006 • Minnesotans annually lose over 59 million hours in traffic at a cost of $1.1 billion including nearly 42 million excess gallons of fuel used due to congested roads • The average driver wastes 43 hours in traffic and 30 gallons of fuel per year • The Texas Transportation Institute (TTI) estimates that metro drivers add a buffer of 1.3 to 1.7 times the normal travel time due to congestion • Delays have increased by 37 hours in the past twenty years, fifth worst in the nation • During the last decade, an average of 600 people per year have been killed in Minnesota traffic accidents • The I35 bridge across the Mississippi River collapsed in August, 2007 killing 13 people
Minneapolis/St. Paul Minneapolis/St. Paul has become one of the most congested metropolitan areas in the country. Source: Texas Transportation Institute
Does congestion really matter? Not if we want to be like LA. Source – David T Hartgen, Professor of Transportation Studies, UNCC • Congestion weakens urban economies because it slows the motion that makes our cities vital • City economies are losing to the suburbs; In 1969, only 11% of America’s largest corporations were in the suburbs, now it’s over 50% • Unreliable delivery bottlenecks the supply chain and increases costs to consumers • Extra warehouses, vehicles, expeditors and other non value added items • Companies must pay higher salaries to attract talent willing to offset commuting time • Unreliable travel times cause drivers to build in ‘buffer’ time to our trips • Congestion costs lives – think EMS
Transportation funding in Minnesota is less than 1% of the general fund, meanwhile other funding sources are declining. Funding facts • Gas tax rate has not increased in over 20 years • MVST revenues are forecasted to decline • Federal funding is generally flat 2008 Minnesota General Fund Allocations Gas Tax Rankings (by state) MNDOT Construction Program
According to the Transportation Alliance, there is over $1.5 billion of unmet annual needs in Minnesota. However, it’s unclear what if any impact this funding will have on reducing congestion.
2030: A tale of two cities? Likely, though not yet funded Needed
Our current transportation policy is not a vision, it’s a fight over funding gaps and taxes. • ‘Ask for as much as we can get’ • Minimal discussion of key metrics like congestion and safety • Funds are allocated based on politics of re-election • Earmarks fund low priority projects • Pressure at state level to fund projects in every district so large projects that reduce congestion often don’t get funded • Many competing interests all vying for their ‘piece of the worm’ • K-12 education • Higher education • Environment • Energy • Health care • Human services • Public safety Our issue isn’t funding, it’s priorities!
There is an absence of leadership on transportation. • Governor • Committed $1 billion in early days of administration to ‘fast track’ high priority projects • Has not articulated a longer term vision for transportation policy • Unclear what level of funding he is willing to support • Appears willing to consider gas taxes along with a bonding package • Does not support other tax increases as funding mechanisms • Legislature • Has not articulated a vision for transportation policy • Appear willing to fund at higher levels than the governor including sales tax increases • Unclear on the priority of transportation policy relative to other issues • Transportation advocates • Have not articulated a vision for transportation policy; trying to ‘get as much as we can get’ • Do of good job of providing information and statistics to decision makers • Do a good job of identifying the needs and raising awareness • Met Council • Created 2030 Regional Transportation Policy • Goal for congestion actually increases the level of congestion in the next 25 years • Goal for highway capacity increase is 20%, goal for transit ridership increase is 100% • Defined criteria and scenarios for funding • Supports public/private partnerhips (PPP’s)
We need a vision for transportation policy. • It should focus on improving our quality of life • Reduce congestion • Improve safety • Reflect our desire to be mobile and drive • Drive economic growth • It must be measurable • Congestion relief • Accident avoidance • It must be based on facts, not emotions • Life cycle analysis • Specific criteria for project selection • It should include a combination of funding mechanisms • Free market approaches such as public private partnerships (PPP’s) • Traditional sources such as bonding • ‘Radical’ ideas such as increasing allocation from the general fund We can start by learning from others.
Houston • Implemented congestion relief program in the early 80’s • Added 100 miles/year of highways from 1986 to 1992 • Reduced average delays for peak travelers 21% • Stopped spending in 1992 and congestion increased to pre-1985 levels • Business community created Trip2000 • Build more road capacity • Manage demand through tolls and access management • Increase overall transportation efficiency • Governor created Texas Metropolitan Mobility Plan • Created congestion targets • Quantified costs/benefits
Atlanta • Recognized that congestion was the biggest problem facing the city • Time to work increased by 24% to 31 minutes in the 90’s • Transit market share was falling • Port of Savannah projected to double volume in seven years • Created the Congestion Mitigation Task Force in 2004 • Made recommendations to the Atlanta Regional Commission (ARC) • Selection criteria based on cost/benefit ratio • Those that helped reach the congestion-mitigation goal the quickest • Projects judged on their merit, efficiency and effectiveness, rather than political benefits
Tampa • Constructed the Crosstown Expressway www.tampa-xway.com/home2 • Reversible lanes • Electronic tolling • Computer based safety controls • Useage is 33% higher than planned with 50% higher than planned tolls
The solution will require strong leadership and new ideas. • Need champions to articulate the vision • Governor Pawlenty • Legislators • Business leaders • Create a congestion reduction task force to lead the effort • Define goals for congestion and safety • Develop criteria for selecting projects • Determine funding needs and methods to achieve • Reconsider existing funding formulas • Determine accountability for results • Consider free market options • Public Private Partnerships (PPP’s) • Toll truckways • Bridge endowments • Twin Cities Express and/or BRT network • Life cycle analysis • Supplement with more traditional funding schemes • Reconsider general fund priorities – Increase percentage given to transportation funding • Increased gas tax – Minnesota has not kept pace with inflation • Increased bonding – Transportation is an investment "There are risks and costs to a program of action. But they are far less than the long-range risks and costs of comfortable inaction." - John F Kennedy
5.00 4.00 3.00 Cents per mile 2.00 1.00 0 1950 1960 1970 1980 1990 2000 2010 Average A word about the gas tax; it’s not a viable long term funding alternative. • Decline in real value of fuel taxes in 1997 dollars
Benefits of Public/Private Partnerships (PPP’s) • Lease, not sale of asset • Source of new capital • Typically raise more money than public agencies • Upfront fees and/or toll revenue sharing • Better management • Life cycle management • New infrastructure faster • Minimize risks to taxpayers
Information Sources • ‘The Road More Traveled’ – Ted Balaker and Sam Staley • ‘Safeguarding and Modernizing America’s Highway Infrastructure’ – Bob Poole, Reason Foundation www.reason.org/ • ‘Minnesota’s Transportation System: Our Future is Riding On It’ – Minnesota Transportation Alliance www.transportationalliance.com • Atlanta Regional Commission www.atlantaregional.com • Texas Transportation Institute tti.tamu.edu/ • Minnesota Department of Transportation www.dot.state.mn.us • American Road and Transportation Builders Association www.artba.org • The Metropolitan Council www.metrocouncil.org/