Download
1 / 11
110 likes | 213 Views
Marker. M95H. M95L. R97A. M95A. R97I. R97E. WT. 20KD. Ec DOS-PAS. 12KD. Fig. S1 : SDS PHAGE patterns of purified wild-type and mutant proteins demonstrate more than 90% homogeneous for proteins used in this work. 0.30. 0.15. 0.15. 0.15. 414 418(417). B. 417 417(418). A.

E N D
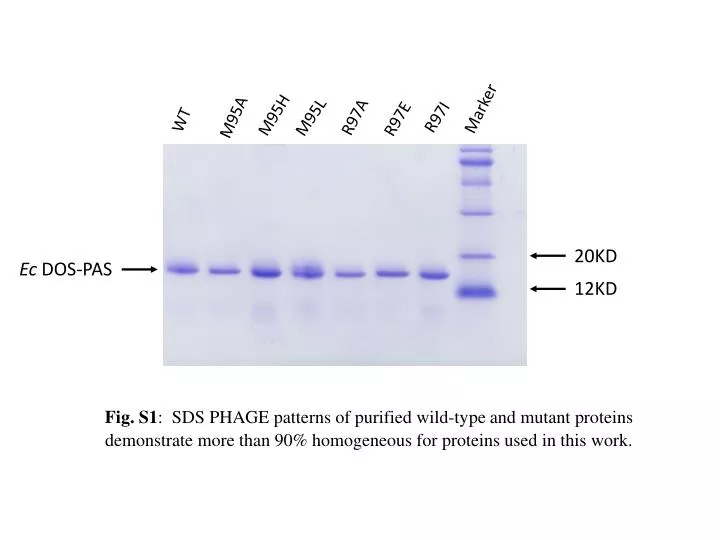
Marker M95H M95L R97A M95A R97I R97E WT 20KD Ec DOS-PAS 12KD Fig. S1: SDS PHAGE patterns of purified wild-type and mutant proteins demonstrate more than 90% homogeneous for proteins used in this work.
0.30 0.15 0.15 0.15 414 418(417) B 417 417(418) A 426 Absorbance Absorbance Absorbance Absorbance 424 0.10 0.10 0.20 0.10 x5 x5 0.10 0.05 0.05 0.05 x10 0.00 0.00 0.00 0.00 600 700 600 700 600 700 600 700 300 400 300 400 300 400 300 400 500 500 500 500 Wavelength (nm) Wavelength (nm) Wavelength (nm) Wavelength (nm) D C 415 416 425 x5 Fig. S2
0.15 0.15 0.15 417 F E 417 418 426 Absorbance Absorbance Absorbance 0.10 0.10 0.10 533, 562 x5 658 0.05 0.05 0.05 0.00 0.00 0.00 600 700 600 600 700 700 300 400 300 300 400 400 500 500 500 Wavelength (nm) Wavelength (nm) Wavelength (nm) Fig. S2. Selected spectra of 1 mMwild-type Ec DOS-PAS (A), M95A (B), M95H (C), M95L (D), R97A (E), R97E (F) and R97I (G) proteins formed by adding 200 mM Na2S under aerobic conditions. Black, blue and red lines represent the His-Fe(III)-OH, His-Fe(III)-SH/His-Fe(II)-Met and final complexes, respectively, formed after addition of Na2S. The final complex is an admixture of His-Fe(II)-O2, His-Fe(III)-OH and modified Fe(III) complexes, or one of the three complexes, depending on the protein (cf. Table 1). Buffer: 50 mM Tris-HCl, pH 7.5. G 417 418 x5 658
417 nm (1) 0.10 427nm (3) 424 nm (4) 418 nm (2) Absorbance 658 nm 0.05 5X 0.00 300 400 500 700 600 Wavelength (nm) Fig. S3. (A) Spectra of R97A without Na2S (black: 1), with Na2S (blue: 2), with Na2S + Na2S2O4 (red: 3) and with Na2S + Na2S2O4 + CO (gray: 4). The spectra correspond with those in Fig. S2 (E).
417 nm (1) 0.10 424 nm (4) 418 nm (2), (3) Absorbance 658 nm 0.05 5X 0.00 300 400 500 700 600 Wavelength (nm) Fig. S3. (B) Spectra of R97A without Na2S (black: 1), with Na2S (blue: 2), with CO (red: 3) and with Na2S + CO + Na2S2O4 (gray: 4). The spectra correspond with those in Fig. S2 (E).
C32H29N4O2Fe1 557.1630 Fig. S4: Tandem massspectra of heme (m/z 616,1763) (A) and verdoheme (m/z 619.1632) (B). Calculated elemental composition of individual fragment ions are depicted in grey above each m/z value. A C34H32N4O4Fe1 616.1763 C31H28N4O2Fe1 C30H26N4Fe1 C29H25N4Fe1 544.1553 C32H27N4O1Fe1 498.1499 539.1525 485.1420 C31H28N4O3Fe1 B 560.1450 C29H25N4O1Fe1 501.1368 C33H31N4O5Fe1 619.1632 C30H27N4O1Fe1 C33H29N4O4Fe1 515.1525 C30H25N4O3Fe1 601.1527 545.1267 460 480 500 520 540 560 580 600 m/z
Fig. S5: Time-dependent verdoheme formation in R97A (20 mM) by adding Na2S (4 mM). The MS spectra were recorded at 0, 5, 10, 20, 30, 60, 90, 120 and 180 min of incubation.The numbers on the right at each particular time represent the ratio between the verdoheme and heme signal intensities in the mass spectrum.
0.15 417 nm (1) 424 nm (4) 427 nm (3) 0.10 Absorbance 418 nm (2) 658 nm 5X 0.05 0.00 300 400 500 700 600 Wavelength (nm) Fig. S6: (A) Spectra of R97I without Na2S (black: 1), with Na2S (blue: 2), with Na2S + Na2S2O4 (red: 3) and with Na2S + Na2S2O4 + CO (gray: 4). The spectra correspond with those in Fig. S2 (G).
0.15 417 nm (1) 424nm (4) 418 nm (2), (3) 0.10 Absorbance 658 nm 5X 0.05 0.00 300 400 500 700 600 Wavelength (nm) Fig. S6: (B) Spectra of R97I without Na2S (black: 1), with Na2S (blue: 2), with CO (red: 3) and with Na2S + CO + Na2S2O4 (gray: 4). The spectra correspond with those in Fig. S2 (G).
Fig. S7: Time-dependent verdoheme formation in R97I (20 mM) by adding Na2S (4 mM). The MS spectra were recorded at 0, 5, 10, 20, 30, 60, 90, 120 and 180 min of incubation.The numbers on the right at each particular time represent the ratio between the verdoheme and heme signal intensities in the mass spectrum.
619.1643 616.1774 583.2551 583.2551 Biliverdin C33H34N4O6 616.1767 Heme C34H32N4O4Fe1 619.1638 Verdoheme C33H31N4O5Fe1 648.1488 Sulfheme C34H32N4O4Fe1S1 Fig. S8. Comparison of the relative intensities of signals of other heme degradation products with the heme/verdoheme signals. Other heme degradation products are much less intense (1% of the base peak – heme/verdoheme – intensity and less) than heme/verdoheme signals. The other non-labeled signals are matrix adducts.