Download
1 / 36
360 likes | 521 Views
The Commercial Nuclear Power Industry Don Lincoln Principal nStone Corporation. September 2011. Agenda. History Current Status What Went Wrong Other Issues – Chernobyl, Fukushima, & High Level Waste Comparison of Current Plants and New Potential New Units Drivers for the Resurgence

E N D
The Commercial Nuclear Power Industry Don LincolnPrincipal nStone Corporation September 2011
Agenda History Current Status What Went Wrong Other Issues – Chernobyl, Fukushima, & High Level Waste Comparison of Current Plants and New Potential New Units Drivers for the Resurgence Small Modular Reactors The Future
1.History • 1942 First sustained and controlled fission reaction • 1946 Formation of the Atomic Energy Commission (AEC) with a civilian branch • 1954 Atomic Energy Act allows private ownership of nuclear reactors • 1954 AEC initiates the Power Reactor Demonstration Program
1.History CP-1 Critical December 2, 1942 University of Chicago Stagg Field Squash Court Under West Grandstand Squash Racket Racquetball Racket
1.History CP-1 Critical December 2, 1942 University of Chicago
1.History AEC - Power Reactor Demonstration Program - 1954
1.History Hallam
1.History Piqua Nuclear Power Station
1.History - 1978 Units On-Order, Under Construction, or Operating • Nuclear Steam Supply (NSS) Vendors • Westinghouse – PWR 95 • Combustion Engineering – PWR 23 • Babcock and Wilcox – PWR 13 • General Electric – BWR 60 • General Atomic – HTGR 1 • Total Units 192 • Reactor Licensing Process • Preliminary Safety Analysis Report, PSAR • (construction license) • Final Safety Analysis report, FSAR and Technical Specifications • (operating license)
1.History – March 28, 1979 Three Mile Island – 2, Harrisburg PA
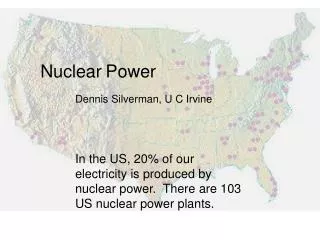
2. Current Industry Status • 104 Nuclear Units Operating Today • PWR 69 • BWR 35 Average Capacity Factor (2010) – 91.1% Average O&M + Fuel Cost (2010) - $17.60 per MWh • Generation by Energy Source – 2006 • Coal 49.0% • Natural Gas 20.0% • Hydro 7.0% • Petroleum 1.6% • Nuclear 19.4% • Other 3.0% 11
3.What Went Wrong? • Utilities projection of growth – 7 to 10 year doubling • TMI and other regulatory issues drove design changes • Massive construction schedule delays • High interest rates in late 1970s and early 1980s (1981 peak in prime rate of 21.5%) • Total project costs increased significantly
4. Chernobyl Accident – April 26, 1986 • RBMK Currently • Now 12 Operating RBMK Units Russia/Lithuania • 48% of Russian Nuclear Capacity in 2010 • Initial Operation 1973 – 1990 • Projected Shutdown 2012 - 2024
4.High Level Waste Blue Ribbon Commission Recommendations for the long term solution to managing the nations used nuclear fuel Yucca Mountain Project
5.Technology Comparison Current Design New Design
** 5.Technology Comparison Simplification of Design Eliminates Components and Reduces Cost 50% FewerValves 35% FewerSafety Grade Pumps 80% LessPipe 45% LessSeismic BuildingVolume 85% LessCable
2.Current Status Construction/Operating License (COL) in Process Construction/Operating License (COL) Suspended/Unscheduled
7.Drivers for the Resurgence Cost to Generate, O&M plus Fuel (2009) $17.60 per MWh Average Capacity Factor – 91.1% 1100 MW Nuclear Plant Average Wholesale Price of Electricity (2010 Est)$50.00 per MWh Average Delivery Cost (T&D) 20% Hours per year 8760 hrs per Year Annual Net Revenue (8760x0.911x1100x($50-$17.60)x0.8 $227,000,000 Payback at a cost to construct of $1500/kW 6.6 Years Payback at a cost to construct of $2500/kW 11.0 Years Payback at a cost to construct of $5300/kW23.24Years Payback at a cost to construct of $6000/kW26.5 Years (Actual recent costs in Japan and Finland: $2300 - $2800/kW) (Estimated Costs USA: Summer $4800 – Turkey Point $4540/kW)
8. Small Modular Reactors Hyperion Power – 27 MW Santa Fe, NM Babcock & Wilcox mPower 125 MW Lynchburg, VA
8. Small reactors GE Hitachi Prism 331 MW Underground Containment NuScale Power - 45 MW Corvallis, OR Toshiba 4S - 10 MW Japan
9. The Future Pebble Bed Modular Reactor ITER Experimental Fusion Reactor