Download
1 / 18
180 likes | 379 Views
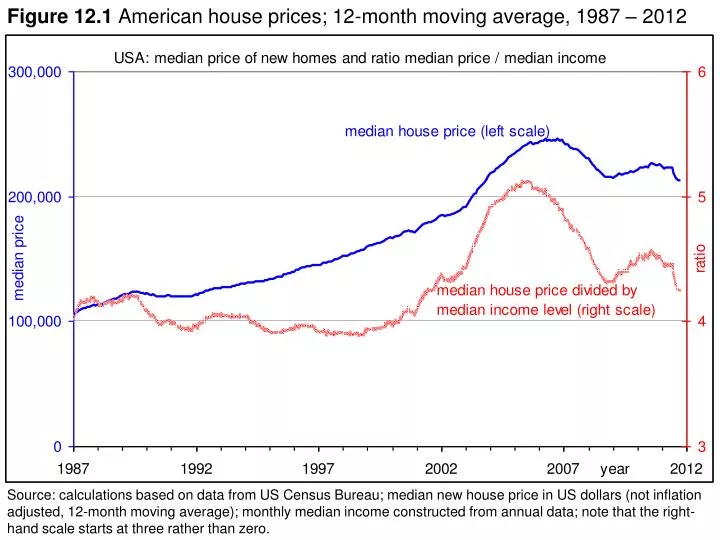
Figure 12.1 American house prices; 12-month moving average, 1987 – 2012.

E N D
Figure 12.1American house prices; 12-month moving average, 1987 – 2012 Source: calculations based on data from US Census Bureau; median new house price in US dollars (not inflation adjusted, 12-month moving average); monthly median income constructed from annual data; note that the right-hand scale starts at three rather than zero.
Figure 12.2Stock market index; monthly data, 1987 – August 2012 Source: OECD Dow Jones EURO STOXX broad index, monthly data
Figure 12.3Maximum loans by Federal Reserve to selected banks ($ bn), 2008-2009 Source: van Marrewijk (2012); indicated are the largest loans to individual banks in billion US $; these occur at different dates, but all are either in 2008 or in 2009.
Figure 12.4Great Recession: real world trade flows (index), 1970 – July 2012 Source: calculations based on World Development Indicators online (world exports of goods and services in constant 2000 US dollar; 1970-1991, annual data) and CPB Netherlands Bureau for Economic Policy Analysis (volume of world merchandise exports; Jan 1991 – July 2012, monthly data); index (2000=100).
Figure 12.5Trade volumes and the Great Recession; selected areas, 2004 – July 2012 Source: calculations based on CPB Netherlands Bureau for Economic Policy Analysis data (volume of exports and imports); see the main text for details; pre-2009 peaks indicated (square, circle, triangle).
Figure 12.5Trade volumes and the Great Recession; selected areas, 2004 – July 2012 Source: calculations based on CPB Netherlands Bureau for Economic Policy Analysis data (volume of exports and imports); see the main text for details; pre-2009 peaks indicated (square, circle, triangle).
Figure 12.6Surprise! OECD’s changing world trade growth projections for 2009 Source: van Marrewijk (2012).
Figure 12.7 Industrial production; monthly growth rates, 2007 – July 2012 Source: calculations based on CPB Netherlands Bureau for Economic Policy Analysis data; growth rate of industrial production in this month relative to the same month one year ago (%).
Figure 12.7 Industrial production; monthly growth rates, 2007 – July 2012 Source: calculations based on CPB Netherlands Bureau for Economic Policy Analysis data; growth rate of industrial production in this month relative to the same month one year ago (%).
Figure 12.8 GDP per capita (PPP); countries with growth and decline (%), 2000-2011 Source: author’s calculations based on data from World Development Indicators online; sample of 171 countries; GDP per capita PPP in constant 2005 international $; countries with growth have per capita income this year larger than previous year
Figure 12.9 USA retail and manufacturing sales; index (1992=100), 1992 – Aug 2012 Source: based on data from US Census Bureau; seasonally adjusted sales, monthly ($ mn)
Figure 12.10 USA inventory/sales ratio; index (period average = 100), 2002 – Jul 2012 Source: based on data from US Census Bureau; seasonally adjusted inventory/sales ratio for manufacturing and trade, monthly data; index relative to period average
Figure 12.11Government net lending / borrowing (% of GDP), 2012-2017 Source: IMF World Economic Outlook database
Figure 12.12Expected general government gross debt (% of GDP), 2012 Source: IMF World Economic Outlook database
Figure 12.13Emerging markets; 20 largest foreign exchange reserves, mid 2011 ($bn) Source: based on The Economist (2011b).
Figure 12.14 Total factor productivity index; 1989 = 100, 1989-2011 Source: author’s calculations based on Conference Board Total Economy Database
Figure 12.15 Sovereign ratings in Europe since 2005; long-term foreign currency Source: based on data from Fitch Ratings; ratings transformed to a scale from 0 (D) to 24 (AAA), at steps of one in the 24 actual ratings given by Fitch (two more ratings than given in Table 12.4).
Figure 12.16 Sovereign ratings since 1997; long-term foreign currency Source: based on data from Fitch Ratings; ratings transformed to a scale from 0 (D) to 24 (AAA), at steps of one in the 24 actual ratings given by Fitch (two more ratings than given in Table 12.4).