Download

1 / 46
470 likes | 675 Views
Analyzing Multidimensional Scientific Data in ArcGIS. Nawajish Noman Kevin Butler. Outline. ArcGIS and Scientific Data Ingest and aggregation Visualization and Analysis Service, Ready-to-Use Maps, Web Applications Extending Analytical Capabilities using Python

E N D
Analyzing Multidimensional Scientific Data in ArcGIS Nawajish Noman Kevin Butler
Outline • ArcGIS and Scientific Data • Ingest and aggregation • Visualization and Analysis • Service, Ready-to-Use Maps, Web Applications • Extending Analytical Capabilities using Python • OPeNDAP and Future Direction Analyzing Multidimensional Scientific Data in ArcGIS
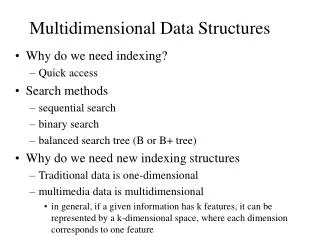
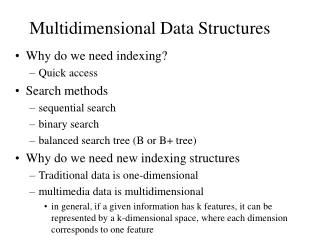
Scientific Data • Stored in netCDF, GRIB, and HDF formats • Multidimensional • Ocean data Sea temperature, salinity, ocean current • Weather data Temperature, humidity, wind • Land Soil moisture, NDVI, land cover Analyzing Multidimensional Scientific Data in ArcGIS
Scientific Data in ArcGIS - Vision Analyzing Multidimensional Scientific Data in ArcGIS
Reading netCDF data in ArcGIS • NetCDF data is accessed as • Raster • Feature • Table • Direct read • Exports GIS data to netCDF Analyzing Multidimensional Scientific Data in ArcGIS
Ingesting Scientific data in ArcGIS • Directly reads netCDF file using • Make NetCDF Raster Layer • Make NetCDF Feature Layer • Make NetCDF Table View • Directly reads HDF and GRIB data as raster Analyzing Multidimensional Scientific Data in ArcGIS
CF Convention • Climate and Forecast (CF) Convention • http://cf-pcmdi.llnl.gov/ • Initially developed for • Climate and forecast data • Atmosphere, surface and ocean model-generated data • Also for observational datasets • CF is now the most widely used conventions for geospatial netCDF data. It has the best coordinate system handling. • Current version 1.6 • You can use Compliance checker utility to check a netCDF file. • http://cf-pcmdi.llnl.gov/conformance/compliance-checker/ Analyzing Multidimensional Scientific Data in ArcGIS
NetCDF and Coordinate Systems • Geographic Coordinate Systems (GCS) • X dimension units: degrees_east • Y dimension units: degrees_north • Projected Coordinate Systems (PCS) • X dimension standard_name: projection_x_coordinate • Y dimension standard_name: projection_y_coordinate • Variable has a grid_mapping attribute. • CF 1.6 conventions currently supports thirteen predefined coordinate systems (Appendix F: Grid Mappings) • Undefined • If not GCS or PCS • ArcGIS writes (and recognizes) PE String as a variable attribute. Analyzing Multidimensional Scientific Data in ArcGIS
Changing Time Slice Time = 1 Analyzing Multidimensional Scientific Data in ArcGIS
What about Aggregation? • Create a seamless multi-dimensional cube from • files representing different regions • files representing different time steps/slices Analyzing Multidimensional Scientific Data in ArcGIS
Scientific data support in Mosaic Dataset • Supports netCDF, HDF and GRIB • Spatial Aggregation • Temporal Aggregation • On-the-fly analysis • Accessible as Map Service • Accessible as Image Service • Supports direct ingest • Eliminates data conversion • Eliminates data processing • Improves workflow performance • Integrates with service oriented architecture Analyzing Multidimensional Scientific Data in ArcGIS
Multidimensional Mosaic Datasets Aggregate (mosaic) spatial, time, and vertical dimensions • Raster Types for netCDF, HDF & GRIB • Define variables when adding Rasters • Each Row is a 2D Raster with variables and dimension values • Define on-the-fly processing • Serve as Multidimensional • Image Service • Map Service • WMS Analyzing Multidimensional Scientific Data in ArcGIS
Demo Analyzing Multidimensional Scientific Data in ArcGIS
Using Scientific Data in ArcGIS • Behaves the same as any layer or table • Display • Same display tools for raster and feature layers will work on multi-dimensional netCDF raster and netCDF feature layers. • Graphing • Driven by the table just like any other chart. • Animation • Multi-dimensional data can be animated through time dimension • Analysis Tools • Will work just like any other raster layer, feature layer, or table. (e.g. create buffers around netCDF points, reprojectrasters, query tables, etc.) Analyzing Multidimensional Scientific Data in ArcGIS
Multidimensional Mosaic Dataset - Visualization • Visualize temporal change of a variable • Visualize a variable at any vertical dimension • Visualize flow direction and magnitude variables Analyzing Multidimensional Scientific Data in ArcGIS
Visualization of Raster as Vectors • New Vector Field renderer for raster • Supports U-V and Magnitude-direction • Dynamic thinning • On-the-fly vector calculation • Eliminates raster to feature conversion • Eliminates data processing • Improves workflow performance Analyzing Multidimensional Scientific Data in ArcGIS
Spatial and Temporal Analysis • Several hundreds analytical tools available for raster, features, and table • Temporal Modeling • Looping and iteration in ModelBuilder and Python Analyzing Multidimensional Scientific Data in ArcGIS
Modeling with Raster function template (RFT) • A scientific model = a raster function template • Windchill = 35.74 + 0.6215T - 35.75(V^0.16) + 0.4275T(V^0.16) • RFT • Created using • Contains Query, GroupName, Variables • Set Mosaic dataset properties • Used during adding raster data Analyzing Multidimensional Scientific Data in ArcGIS
Demo Analyzing Multidimensional Scientific Data in ArcGIS
Sharing / WMS Support (for multi-dimensions) • Map Service (supports WMS) • Makes maps available to the web. • Image Service (supports WMS) • Provides access to raster data through a web service. • Geoprocessing Service • Exposes the analytic capability of ArcGIS to the web. • Map Package • To share complete map documents and the data referenced by the layer it contains. • Geoprocessing Package • To share your geoprocessing workflow. Analyzing Multidimensional Scientific Data in ArcGIS
Publishing a WMS on ArcGIS Server • Enable WMS capabilities on Service Editor or Manager Analyzing Multidimensional Scientific Data in ArcGIS
Multi-dimensional data support in WMS • getCapabilities • Supports time, elevation and other dimensions (e.g. depth) • getMap • Returns map for any dimension value &DIM_<dimensionName>=<value>& • Supports CURRENT for time dimension &TIME=CURRENT& • getFeatureInfo • Returns information about feature for any dimension value Analyzing Multidimensional Scientific Data in ArcGIS
Multi-dimensional WMS in ArcMap • Supports WMS layer like any other layer • Animates a time enabled WMS layer using time-slider • Slices for any dimension value are accessible with ArcObjects Public Sub UpdateWMSServiceLayerDimensionValue() 'UID for wms service layer type Dim pUid As New uid pUid = "{27ABB9EC-7A26-4cf8-8BD4-70EC1D274E17}" Dim pWMSMapLayer2 As IWMSMapLayer2 'calling a function to find the layer from active dataframe Set pWMSMapLayer2 = GetLayer(pUid, "myWMSLayer") 'setting values to dimensions Dim pDimNameValues As IPropertySet Set pDimNameValues = New PropertySet pDimNameValues.SetProperty "Depth", "500" 'dimension#1 pDimNameValues.SetProperty "T1", "500" 'dimension#2 Set pWMSMapLayer2.DimensionValues = pDimNameValues 'calling a function to redraw the layer RefreshActiveDataFrame End Sub Analyzing Multidimensional Scientific Data in ArcGIS
WMS in Dapple Earth Explorer Analyzing Multidimensional Scientific Data in ArcGIS
Multi-dimensional WMS in a Web Application Depth Time http://dtc-sci01.esri.com/MultiDimWMSViewer/ Analyzing Multidimensional Scientific Data in ArcGIS
ArcGIS Online • Curated, authoritative content provided by Esri • Ready To Use • Highly scalable • Global to National • Authoritative content provided by the community • Hosted in your ArcGIS Online Organization account • Hosted on your hardware and shared to ArcGIS Online > 100 Tb of data > 150 millions maps per day Analyzing Multidimensional Scientific Data in ArcGIS
Ready-to-Use Maps http://www.arcgis.com/features/maps/index.html Analyzing Multidimensional Scientific Data in ArcGIS
Ready-To-Use Analysis Services • Esri hosted analysis on Esri hosted data • Simplify job of GIS Professionals • Can be used in models and scripts just like any other tool • Extend spatial analysis to a much broader audience • Available in Desktop or as REST service Best practices published to the Resource Center Analyzing Multidimensional Scientific Data in ArcGIS
Ready-to-Use Scientific Data Maps • GLDAS Noah Land Surface Model Outputs • Evapotranspiration • Soil Moisture • Snow Pack • Other Analyzing Multidimensional Scientific Data in ArcGIS
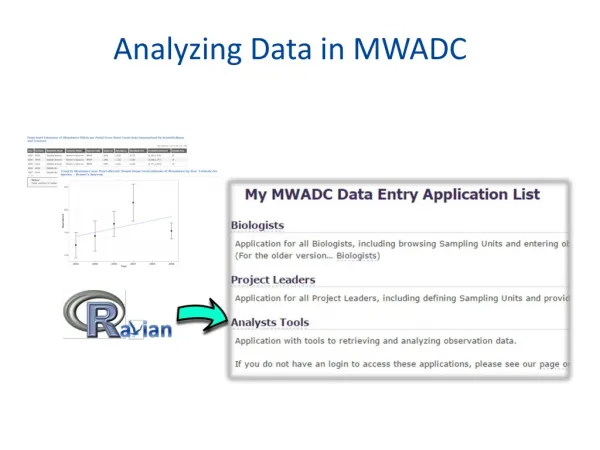
Web Application Analyzing Multidimensional Scientific Data in ArcGIS
Web Application Analyzing Multidimensional Scientific Data in ArcGIS
Tell the story of your scientific data – Create Story Maps http://dtc-sci01.esri.com/DeadZoneStoryMap/ Analyzing Multidimensional Scientific Data in ArcGIS
Demo Analyzing Multidimensional Scientific Data in ArcGIS
Supplemental tools OPeNDAP to NetCDF Make NetCDF Regular Point Layer Make NetCDF Station Point Layer Make NetCDF Trajectory Point Layer Describe Multidimensional Dataset Get Variable Statistics Get Variable Statistics Over Dimension Multidimensional Zonal Statistics Multidimensional Zonal Statistics As Table http://blogs.esri.com/esri/arcgis/2013/05/24/introducing-the-multidimension-supplemental-tools-2/ Python and Geoprocessing Tools Analyzing Multidimensional Scientific Data in ArcGIS
Application Specific Script Tools • Python is used to build custom tools for specific tasks or datasets Analyzing Multidimensional Scientific Data in ArcGIS
Community Developed Tools • Geoprocessing Resource Center http://resources.arcgis.com/geoprocessing/ • Marine Geospatial Ecology Tools (MGET) • Developed at Duke Univ. • Over 180 tools for importmanagement, and analysis of marine data http://mgel.env.duke.edu/mget • Australian Navy tools (not publicly available) Analyzing Multidimensional Scientific Data in ArcGIS
netCDF4-python is included in 10.3/Pro Read and write netCDF file Conversion time values to date Multi-file aggregasion Compression https://www.unidata.ucar.edu/software/netcdf/workshops/2012/netcdf_python/netcdf4python.pdf netCDF4-Python Analyzing Multidimensional Scientific Data in ArcGIS
Create Space-Time Cube & Emerging Hot Spot Analysis Analyzing Multidimensional Scientific Data in ArcGIS
Creating your own tool Analyzing Multidimensional Scientific Data in ArcGIS
OPeNDAP to NetCDF Analyzing Multidimensional Scientific Data in ArcGIS
Next: Make OPeNDAP Layer • Ingest OPeNDAP Service • Output dynamic multidimensional raster • Support Sub-setting Analyzing Multidimensional Scientific Data in ArcGIS
Things to Consider… • Embrace the Common Data Model (netCDF, HDF etc.) • Use Data and metadata standards (OGC, CF etc) • Produce and use CF complainant data • Make your data “spatial” (by specifying geographic or a projected coordinate system) • Create sample tools where possible • Clearly define workflow and requirements Analyzing Multidimensional Scientific Data in ArcGIS
Demo Analyzing Multidimensional Scientific Data in ArcGIS
Scientific Data Sessions • NetCDF, Kevin Sigwart, • Demo Theater – Federal Showcase, Tuesday, 15 Jul 2014, 11:30am – 12:00pm • Atmospheric, Weather and Climate SIG • Room 24C, Tuesday, 15 Jul 2014, 12:00pm - 1:00pm • Weather in GIS - See Weather in Esri's Maps & Apps, Sudhir Shrestha & Dan Zimble • Session, Ballroom 20D, Tuesday, 15 Jul 2014, 3:15pm - 4:30pm • Using Rasters to Measure Impact of Weather on Military Operations, Matt Funk • Demo Theater - Imagery Island Exhibit Hall C, Wednesday, 16 Jul 2014, 11:30am - 12:00pm • Analyzing Multidimensional Scientific Data in ArcGIS, Nawajish Noman & Kevin Butler • Technical Workshop, Room 17A, Wednesday, 16 Jul 2014, 1:30pm – 2:45pm • ArcGIS for the Military: Analyzing Environmental Impact on Operations, John Fry & Matt Funk • Session, Omni Ballroom A/B, Wednesday, 16 Jul 2014, 3:15pm - 4:30pm • Working with Scientific Data Using Mosaic Datasets, Hong Xu • Demo Theater - Imagery Island Exhibit Hall C, Wednesday, 16 Jul 2014, 3:30pm – 4:00pm • Analyzing Multidimensional Scientific Data in ArcGIS, Nawajish Noman & Kevin Butler • Technical Workshop, Room 17B, Thursday, 17 Jul 2014, 8:30am – 9:45am • Analyzing Maritime Weather, John Fry & Matt Funk • Demo Theater - Defense and Intel - National Security, Thursday, 17 Jul 2014, 11:30am - 12:00pm Analyzing Multidimensional Scientific Data in ArcGIS
Thank you… Please fill out the session survey: First Offering ID: 1309 Second Offering ID: 1414 Online – www.esri.com/ucsessionsurveys Paper – pick up and put in drop box Analyzing Multidimensional Scientific Data in ArcGIS