Download
1 / 24
240 likes | 562 Views
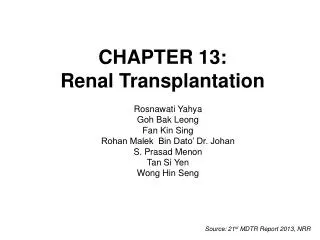
CHAPTER 2 CORNEAL TRANSPLANTATION. Editors: Dr Shamala Retnasabapathy Dr Chandramalar Santhirathelagan Expert Panel: Dr Shamala Retnasabapathy (Chairperson) Dr Chandramalar Santhirathelagan Dr Choong Yean Yaw Dr Michael Law Sie Haur Prof Dato’ Dr Veera Ramani Dr Thiageswari Umapathy

E N D
CHAPTER 2CORNEAL TRANSPLANTATION Editors: Dr Shamala Retnasabapathy Dr Chandramalar Santhirathelagan Expert Panel: Dr Shamala Retnasabapathy (Chairperson) Dr Chandramalar Santhirathelagan Dr Choong Yean Yaw Dr Michael Law SieHaur Prof Dato’ Dr Veera Ramani Dr Thiageswari Umapathy Assoc Prof Dr Mohtar Ibrahim
Table 2.1.1: Number of Corneal Transplantation and Transplant Rate per million population (pmp), 1998-2008 Table 2.1.2: Types of Corneal Transplant, 1998-2008
Table 2.2.1: Gender Distribution, 1998-2008 Table 2.2.2: Ethnic Distribution, 1998-2008
Table 2.2.3: Age Distribution of Corneal Transplant Recipient Patients, 1998-2008
Table 2.3.1.1: No of Previous Grafts in Grafted Eye, 2004-2008 Table 2.3.1.2: Ocular Co-morbidity, 2004-2008 *Patient might have multiple ocular co-morbidities
Local USA Sri Lanka 70 60 50 40 Percent 30 20 10 0 2004 2005 2006 2007 2008 Year Table 2.3.2.1: Source of Donor Cornea Tissue, 2004-2008 Figure 2.3.2.1: Source of Donor Corneal Tissue, 2004-2008
Optisol MK Medium Moist Chamber 80 70 60 50 Percent 40 30 20 10 0 2004 2005 2006 2007 2008 Year Table 2.3.2.3: Preservation Media, 2004-2008 Figure2.3.2.3: Preservation Media, 2004-2008
Table 2.3.3.1: Types of Surgeries, 2004-2008 * In the year 2004 there were a total of 184 corneal transplants performed but complete data set was only received for 138 patients Table 2.3.3.2: Types of Combined Surgeries, 2004-2008 *Patients may have more than one combined surgery
Table 2.3.3.4: Difference in Trephined Sizes of Recipient and Donor Corneas, 2004-2008 Table 2.3.3.5: Suture Technique, 2004-2008
1.00 0.80 0.60 Cumulative survival 0.40 0.20 0.00 0 12 24 36 48 Duration in months Table 2.4.2.1: Graft Survival, 2004-2008 Figure2.4.2.1: Graft Survival, 2004-2008
1.00 0.75 Optical Cumulative survival Non-Optical 0.50 0.25 0.00 0 12 24 36 48 Duration in months Table 2.4.2.2: Graft Survival by Optical and Non-optical Indication, 2004-2008 Figure2.4.2.2: Graft Survival by Optical and Non-optical Indication, 2004-2008
1.00 0.75 Female Cumulative survival Male 0.50 0.25 0.00 0 12 24 36 48 Duration in months Table 2.4.2.3 Graft Survival by Gender, 2004-2008 Figure2.4.2.3 Graft Survival by Gender, 2004-2008
1.00 10-19 years 0.75 20-29 years >=40 years Cumulative survival 0.50 0-9 years 0.25 0.00 0 12 24 36 48 Duration in months Table 2.4.2.4 Graft Survival by Age, 2004-2008 Figure2.4.2.4 Graft Survival by Age, 2004-2008
Table 2.4.2.5: Causes of Graft Failure * Each patient may have more than one cause of graft failure 77 patients had 1 cause 34 patients had 2 causes 3 patients had 3 causes 1 patient had 4 causes
Optical Non-optical 60 50 40 Percent 30 20 10 0 Vision Better Vision same Vision worse Not known Vision Table 2.4.3.1: Availability of Data on Post Corneal Transplant Unaided Vision Table 2.4.3.2: Unaided Visual Outcome After Cornea Transplant Surgery Figure2.4.3.2: Unaided Visual Outcome After Cornea Transplant Surgery
1 0.8 Cumulative Probability 0.6 0.4 0.2 6/6 6/12 6/24 6/60 4/60 2/60 CF PL 6/9 6/18 6/36 5/60 3/60 1/60 HM NPL Unaided Vision optical non optical Table 2.4.3.3: Unaided Vision for Optical and Non Optical Cases Figure 2.4.3.3: Unaided Vision for Optical and Non Optical Cases
Table 2.5.1: Post Transplant Complications Table 2.5.2: Post Transplant Graft Rejection Types