Download
1 / 33
340 likes | 478 Views
It is the science of planning studies and experiments, obtaining sample data, and then organizing, summarizing, analyzing, interpreting data , and drawing conclusions about a population based on the data. Statistics.

E N D
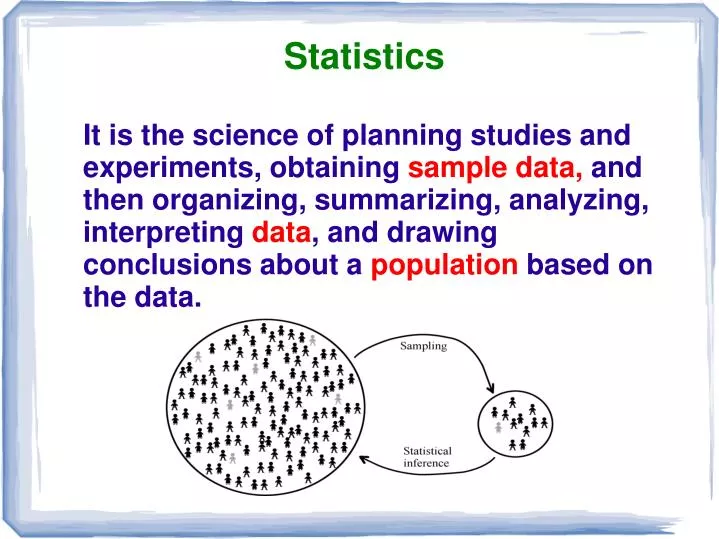
It is the science of planning studies and experiments, obtaining sample data, and then organizing, summarizing, analyzing, interpreting data, and drawing conclusions about a population based on the data. Statistics
Sample data are the collection ofobservations (such as measurements, genders, survey responses---data values) Sample Data
It is the complete collection of all individuals (scores, people, measurements, and so on) to be studied; the collection is complete in the sense that it includes all of the individuals to be studied. Population
The subject of statistics is largely about using sample data to make inferences (or generalizations) about an entire population. It is essential to know and understand the definitions and the distinction between “parameter” and “statistic.” Statistical Values
It is a numerical measurement describing some characteristic of a population. Parameter population parameter
It is a numerical measurement describing some characteristic of sample data. sample statistic Statistic
Categorical Data Categorical (or qualitative or attribute) data consists of names or labels (representing categories) Example: The genders (male/female) of professional athletes Example: Shirt numbers on professional athletes uniforms - substitutes for names.
Nominal Level Nominal level of measurement characterized by data that consist of names, labels, or categories only, and the data cannot be arranged in an ordering scheme (such as low to high) Example: Survey responses yes, no, undecided
Ordinal Level Ordinal level of measurement involves data that can be arranged in some order, but differences between data values either cannot be determined or are meaningless Example: Course grades A, B, C, D, or F
Quantitative (or numerical) data consists of numbers representing counts or measurements. Example: The weights of supermodels Example: The ages of respondents Quantitative Data
Discrete data result when the number of possible values is either a finite number or a ‘countable’ number (i.e. the number of possible values is 0, 1, 2, 3, . . .) Example: The number of eggs that a hen lays Discrete Data
Continuous (numerical) data result from infinitely many possible values that correspond to some continuous scale that covers a range of values without gaps, interruptions, or jumps. Example: The amount of milk that a cow produces; e.g. 2.343115 gallons per day Continuous Data
It shows how a data set is partitioned among all of several categories (or classes) by listing all of the categories along with the number of data values in each of the categories. Frequency Distribution
A graph consisting of bars of equal width drawn adjacent to each other (without gaps). The horizontal scale represents the classes of quantitative data values and the vertical scale represents the frequencies. The heights of the bars correspond to the frequency values. Histogram
It is the measure of center obtained by adding the values and dividing the total by the number of values. What most people call an average. 24 + 31 + 28 + 22 + 34 + 29 + 27 + 25 27.5= 8 Arithmetic Mean The symbol for mean is pronounced ‘x-bar’ and denotes the mean of a set of sample values
Mean • AdvantagesIt is relatively reliable, means of samples drawn from the same population don’t vary as much as other measures of center.Takes every data value into account. • DisadvantageIt is sensitive to every data value, one extreme value can affect it dramatically; it is not a resistant measure of center.
It is the middle value when the original data values are arranged in order of increasing (or decreasing) magnitude. It is not affected by an extreme value - is a resistant measure of the center. Median 5.40 1.10 0.42 0.73 0.48 1.10 0.42 0.48 0.73 1.10 1.10 5.40 (in order - even number of values – no exact middle shared by two numbers) 0.73 + 1.10 MEDIAN is 0.915 2
Range Therangeof a set of data values is the difference between the maximum data value and the minimum data value. Range = (maximum value) – (minimum value) It is very sensitive to extreme values; therefore not as useful as other measures of variation.
Standard Deviation Thestandard deviationof a set of sample values, denoted by s, is a measure of variation of values about the mean.
Properties of theStandard Deviation (part 1) • Measures the variation among data values • Values close together have a small standard deviation, but values with much more variation have a larger standard deviation • Has the same units of measurement as the original data
Empirical (or 68-95-99.7) Rule For data sets having a distribution that is approximately bell shaped, the following properties apply: • About 68% of all values fall within 1 standard deviation of the mean. • About 95% of all values fall within 2 standard deviations of the mean. • About 99.7% of all values fall within 3 standard deviations of the mean.
Properties of theStandard Deviation (part 2) • For many data sets, a value is unusual if it differs from the mean by more than two standard deviations • Compare standard deviations of two different data sets only if the they use the same scale and units, and they have means that are approximately the same
Thecoefficient of variation(or CV) for a set of nonnegative sample or population data, expressed as a percent, describes the standard deviation relative to the mean. Coefficient of Variation
Quartiles Are measures of location, denoted Q1, Q2, and Q3, which divide a set of data into four groups with about 25% of the values in each group. • Q1 (First Quartile)separates the bottom 25% of sorted values. • Q2 (Second Quartile)same as the median; separates the bottom 50% of sorted values. • Q3 (Third Quartile)separates the bottom 75% of sorted values.
25% 25% 25% 25% Q1 Q2 Q3 (minimum) (maximum) (median) 5-Number Summary For a set of data, the5-number summary consists of the minimum value Q0; the first quartile Q1; the median (or second quartile Q2); the third quartile, Q3; and the maximum value Q4.
Interquartile Range It is used for the measure of variation, and defined as the difference between Q1 and Q3: IQR = Q3 - Q1
Boxplot • Aboxplot(orbox-and-whisker-diagram) is a graph of a data set that consists of a line extending from the minimum value to the maximum value, and a box with lines drawn at the first quartile, Q1; the median; and the third quartile, Q3.
Outliers • Anoutlieris a value that lies very far away from the vast majority of the other values in a data set.
Outliers for Modified Boxplots For purposes of constructing modified boxplots, we can consider outliers to be data values meeting specific criteria. In modified boxplots, a data value is an outlier if it is . . . above Q3 by an amount greater than 1.5 IQR or below Q1 by an amount greater than 1.5 IQR
Modified Boxplot Construction A modified boxplot is constructed with these specifications: • A special symbol (such as an asterisk) is used to identify outliers. • The solid horizontal line extends only as far as the minimum data value that is not an outlier and the maximum data value that is not an outlier.


