Download
1 / 37
370 likes | 526 Views
ESTIMATION OF EARTHQUAKE DAMAGE FROM AERIAL IMAGES BY PROBABILISTIC METHOD. Shota Izaka , Hitoshi Saji (Shizuoka University). Introduction. Backgrounds. After large-scale earthquake Urban areas are seriously damaged Many people require rescuing and aid

E N D
ESTIMATION OFEARTHQUAKE DAMAGEFROM AERIAL IMAGESBY PROBABILISTIC METHOD ShotaIzaka, Hitoshi Saji (Shizuoka University)
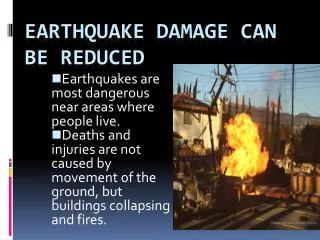
Backgrounds • After large-scale earthquake • Urban areas are seriously damaged • Many people require rescuing and aid • For effective rescue and victim support • Rapid action is needed • A wide range of information is important Aerial images are suitable for disaster observation
Conventional method • Matching analysis • Comparing pre-disaster and post-disaster images • Difficulty of matching analysis • Difficult to obtain pre-disaster images • Affected by shooting conditions and time • Changes of shadows • Construction and destruction of buildings
Our goals • Rapidanalysis of damage • Use only post-disaster aerial images • Not using the training data • Assisting various rescue and victim support activities • Providing information available for various purposes Assisting human decisions
Ways of assisting human decisions • Remaining undetermined regions • We don’t force to classify all regions • The final decision is left to the people in the field • Showing the likelihood of damages • The result available for various purposes • Target area estimation of rescue activity • Determination of the road passable for emergency vehicles
Overview Road mask creation Digital map Segmentation Aerial Image Feature extraction Region classification Result for buildings Result for roads
Road mask creation • Creating road mask from digital map • Roads change little over time Our method is not affected by the time when the map is created Digital map Road mask
Segmentation • Initial Segmentation • Segment into small basic regions • Unification of similar regions • Considering color and textures • Avoiding to unify roads and buildings Before segmentation After segmentation
Feature extraction • Collapsed buildings • Segmented into small regions • Having short random edges Extracting short edges as a feature of damages Collapsed buildings Segmented regions Edges
Feature extraction • Undamaged buildings • Maintaining their shapes • Having a large area Extracting building regions as a feature of undamaged Edges Undamaged buildings Segmented regions
Region classification • Using the probabilistic relaxation method • Labeling method using the probability We use the method to classify each region by damage probability
Defining initial probability • Considering extracted features • The proportion of short edges • The area of region • Building region or not Large area High short edge rate Building Probability definitions
Probability update • Update using similarity • Considering the region similar to damaged region as damaged region High High High High High High High High High High Low High High High High High Probability update model
Extracting undamaged regions • Regions are converged high or low probability • Extracting low probability regions as undamaged regions • Considering regions not converged as undetermined regions Undetermined High probability Low probability Result of extraction
Extracting damaged regions • Extracting damaged regions from high probability regions Undetermined Low probability High probability Undetermined Damaged Damaged regions extraction model
Redefining initial probability • Redefining probability by randomness of edges • Using variance of edge angles Edge model of undamaged buildings Edge model of collapsed buildings
Result of classification • ■:Undamaged regions • ■:Undetermined regions 1 • Low risk of damage • ■:Undetermined regions 2 • High risk of damage • ■:Damaged regions Undetermined Undetermined Undamaged Damaged Result of classification
Image division • Dividing a result image into buildings and roads • Result of buildings • Estimation of building damages • Result of roads • Determination of road passable
Data • Aerial images • Great Hanshin Earthquake • Captured on January 18, 1995 • Provided by PASCO Corp. • Digital map • A topographic map of Kobe city • Provided by Kobe City Urban Planning Bureau
Result of classification for buildings Input image Result image ■:Undamaged regions ■:Undetermined regions 1 ■:Undetermined regions 2 ■:Damaged regions
Resultof classification forroads Input image Result image ■:Undamaged regions ■:Undetermined regions 1 ■:Undetermined regions 2 ■:Damaged regions
Evaluation of accuracy • Creating answer images • Using visual judgment • Comparing with results Damaged Undamaged Undetermined Undetermined Undamaged Damaged Answer Result of classification
Detection rate • Evaluating pixels in same category Damaged Damaged Undamaged Damaged Undamaged Undamaged Undamaged Damaged Answer Result of classification
Detection ratewith human decisions • Estimating rate after human decisions • Adding undetermined regions Damaged Undamaged Damaged Damaged Undamaged Undamaged Damaged Undamaged Answer Result
False detection rate • Evaluating pixels in wrong category • Visual judgment Considered undamaged regions Damaged Undamaged Damaged Considered damaged regions Undamaged Result of classification
Answer for buildings Answer image Result image ■:Undamaged regions ■:Undetermined regions 1 ■:Undetermined regions 2 ■:Damaged regions
Answer forroads Answer image Result image ■:Undamaged regions ■:Undetermined regions 1 ■:Undetermined regions 2 ■:Damaged regions
Result of accuracy evaluation in buildings • Undamaged regions • Detection rate:77.2% • With human decisions:93.1% • False detection rate:10.1% • Damaged regions • Detection rate:74.0% • With human decisions:87.0% • False detection rate:17.7%
Result of accuracy evaluation in roads • Undamaged regions • Detection rate:85.5% • With human decisions:93.4% • False detection rate:19.0% • Damaged regions • Detection rate:65.3% • With human decisions:79.6% • False detection rate:14.6%
Review of results • Obtained high detection rates • Except for damaged regions in roads • Features of damage on roads are unclear • Many regions classified into “Undetermined” Requiring human decisions Road image Result of classification
Review of results • Obtained low false detection rates • Roads have more errors than buildings • Caused by objects on roads • Cars, roofs, shadows of buildings Roof and car Error Shadow and car Error
Conclusion • Our results can be used for various rescue and victim support activity • Estimation of building damages • Determination of road passable • Our future directions • Improving building detection • Detectingobjects on roads
The Sendai earthquake • Most of the damage was caused by the Tsunami • Most of the buildings are flooded out • Our method aim to detect collapsed buildings • Huge area of damage • Not possible to capture by aerial images Applying to the earthquake is future works