Download
1 / 45
450 likes | 533 Views
Session I PM Overview and Sources. WESTAR PM EI Workshop, Denver, CO March 2004 Thompson G. Pace OAQPS US EPA. Topics to be Covered. PM2.5 Sources & Composition Ambient Composition What are the Important Sources The NEI & Emission Inventory Tools What is Contained in the NEI

E N D
Session IPM Overview and Sources WESTAR PM EI Workshop, Denver, CO March 2004 Thompson G. Pace OAQPS US EPA
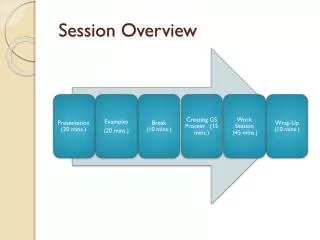
Topics to be Covered • PM2.5 Sources & Composition • Ambient Composition • What are the Important Sources • The NEI & Emission Inventory Tools • What is Contained in the NEI • Emissions Inventory Tools • Process-based Emissions Models • Emissions Processing • Emissions Overview
PM2.5 Sources and Composition Thompson G Pace US EPA March 2004
37-State(+DC) Emissions in ’99 NEI (MSA to Non MSA Comparison ) Urban areas responsible for most PM2.5 & precursor emissions – except NH3
Sulfates, Nitrates &Ammonia Sources and Spatial Extent
Comparison of Urban~Rural Ratios of SO2, NOx Emissions & Ambient Sulfate, Nitrate Ratio of Urban / Rural Note: Sulfate particles are more stable and thus have longer lifetime in the atmosphere than Nitrate. Sulfate is therefore more subject to transport
Sulfates& Nitrates • Formed in atmosphere from SO2 & NOx • Usually found as Ammonium Sulfate / Nitrate • Urban ~ Rural Patterns • Emission densities of both SO2 & NOx: • > in urban than in rural areas • Ambient Nitrate: • has an “urban excess” (as does Carbon) • Ambient Sulfate: • NO “urban increment” (flat across large regions) • Why ? Sulfate is more stable ~ longer “lifetime”
NOx – Precursor to Ammonium Nitrate and Ozone (National Emissions ~ 23M TPY)
SO2 – Precursor to Ammonium Sulfate Formation(National Emissions ~ 17.6 M TPY)
NH3 – Precursor to Ammonium Sulfate & Nitrate(National Emissions ~ 4.8 M TPY)
Ammonia - Key Sources & Issues • Key categories in current EI • Animal Husbandry (80%) • Fertilizer Application (10%) • Point Sources (could be large locally), Mobile Sources • Missing Sources (May not all be major sources) • Humans, Domestic and wild animals • Open burning • Soils and Vegetation • Can be source or sink -- Work ongoing: TX, CA, EPA/ORD • Ammonia is Important to AQ Analyses • Involved in formation of Sulfate, Nitrate • SO2, NOx may be subject to regulation
Crustal& Carbon Their Sources & Regional Extent
Crustal Materials (Mainly Fugitive Dust) • Main Sources: • Unpaved roads • Agricultural tilling • Construction • Windblown dust, Fly ash
Crustal Materials (Mainly Fugitive Dust) • Main Sources: • Unpaved roads • Agricultural tilling • Construction • Windblown dust, Fly ash • Huge Disparity Between EI & Ambient Data • Ambient Data • < 1 ug/m3 in most of US • Exception: > 1 ug/m3 in much of Southwest, California • Emissions: 2.5M TPY (comparable to Carbon Emissions)
Crustal Materials (Mainly Fugitive Dust) • Main Sources: • Unpaved roads • Agricultural tilling • Construction • Windblown dust, Fly ash • Huge Disparity Between EI & Ambient Data • Ambient Data • < 1 ug/m3 in most of US • Exception: > 1 ug/m3 in much of Southwest, California • Emissions: 2.5M TPY (comparable to Carbon Emissions) • Fugitive Dust has low “Transportable Fraction”
Crustal Materials • Crustal materials are a relatively small part of PM2.5 in the ambient air • Fugitive dust is released near the ground and surface features often capture the dust near its source • As much as 50-90% may be captured locally. (More on this later….)
Identifying the Key Sources of Carbon From within the PM2.5 Emissions Inventory
Primary Particles Secondary Particles Secondary Organic Aerosol Elemental Carbon Primary Organic Aerosol Organic Carbon Carbon Particles + + • Primary & Secondary Particles
Primary Particles Secondary Particles Secondary Organic Aerosol Elemental Carbon Primary Organic Aerosol Organic Carbon Carbon Particles: Composition & Terminology • Primary Particles • Elemental (Black) Carbon • Primary Organic Aerosol (POA) • Primary Carbon = EC (BC) + Primary Organic Aerosol (POA)
Primary Carbon in PM2.5 % of PM2.5 Primary Carbon Emissions (National Emissions ~ 2M TPY)
Comparison of Emission Density Ratios (Urban~Rural) ~ Primary Carbon Emissions Emission Density Ratios (Urban : Rural) 80% POA 20% EC * Eastern US
Primary Particles Secondary Particles Secondary Organic Aerosol Elemental Carbon Primary Organic Aerosol Organic Carbon Carbon Particles: Composition & Terminology • Primary Particles • Elemental (Black) Carbon • Primary Organic Aerosol (POA) • Primary Carbon = EC (BC) + Primary Organic Aerosol (POA) • Secondary Particles • Secondary Organic Aerosol (SOA)
Primary Particles Secondary Particles Secondary Organic Aerosol Elemental Carbon Primary Organic Aerosol Organic Carbon Carbon Particles: Composition & Terminology • Primary Particles • Elemental (Black) Carbon • Primary Organic Aerosol (POA) • Primary Carbon = EC (BC) + Primary Organic Aerosol (POA) • Secondary Particles • Secondary Organic Aerosol (SOA) • Organic Carbon= POA & Secondary Organic Aerosols
Primary Particles Secondary Particles VOC Free Radical Pool Secondary Organic Aerosol Elemental Carbon Primary Organic Aerosol Organic Carbon Carbon Particles – SOA VOC Provides OH Radicals • SOA formed in atmosphere from VOC’s • Lighter VOC’s provide the oxidants (OH) • Heaviest organic gases may condense to form OC • Condensibles considered Primary ~ Not SOA • Acidic particles may increase SOA formation • Aromatics & Terpenes provide the reactants
Emissions: 2.2M tpy (Ann) 3.7 M tpy (Ann) .35 M tpy (July) Comparison of Emission Density Ratios (Urban~Rural) ~ Primary Carbon vs Precursor Emissions Emission Density Ratios (Urban : Rural) 70% Mobile 80% POA 20% EC Biogenic * Eastern US
Urban Ambient Carbon vs Rural Ambient Carbon* (Ambient Carbon = EC + POA + SOA) Ambient Concentration Ratios (Urban : Rural) • What we breathe is comprised of EC, POA & SOA • Ambient Carbon is 2x Higher in Urban Areas • We call this the Carbon “Urban Excess” * Eastern US
Primary Particles Secondary Particles VOC Free Radical Pool Secondary Organic Aerosol Elemental Carbon Primary Organic Aerosol Organic Carbon Carbon Particles – “Urban Increment” • Urban vs Rural ~ Total Carbon’s “Urban Excess” • Ambient Measurements ~ 2X higher in Urban Areas • Emission Density • Primary ~ 3 to 4 X higher in urban areas • Aromatics ~ 5 X higher in urban areas • Terpines ~ emissions density is flat
Lets Review • Carbon: POA & SOA • Precursor Interrelationships
Primary Particles Secondary Particles VOC Free Radical Pool Secondary Organic Aerosol Elemental Carbon Primary Organic Aerosol Carbon Particles – POA ~ SOA Summary Organic Aerosols