Download

1 / 18
180 likes | 293 Views
Practice Profiles. Dr John Battersby Medical Director, erpho. Background. Increasing need for practice level data Policy focus on primary care – especially quality and performance PCTs developing their own approach (e.g. Tower Hamlets Balanced Scorecard). Primary care data sources.

E N D
Practice Profiles Dr John Battersby Medical Director, erpho
Background • Increasing need for practice level data • Policy focus on primary care – especially quality and performance • PCTs developing their own approach (e.g. Tower Hamlets Balanced Scorecard)
Primary care data sources • Practice systems • Not easily accessible • “Commercial” databases (QResearch and THIN) • GPES (hopefully not Godot!) • Quality and Outcomes Framework (QOF) • Introduced in 2004 • 129 indicators included in 2008-09
QOF • Intended to drive up quality • Not a performance management tool • Underpinned by QMAS – Quality Management Analysis System (Connecting for Health) • QOF/QMAS use same coding system as primary care clinical systems: Read Coding
Other tools • Primary Care Commissioning Support Tool (http://www.pcc.nhs.uk/572 ) • Primary Care Contracting Quality and Productivity Calculator (http://www.pcc.nhs.uk/primary-care-quality-and-productivity-challenge ) • SHAPE Tool (http://www.nepho.org.uk/topics/SHAPE%20-%20Strategic%20Health%20Asset%20Planning%20and%20Evaluation ) • NHS Comparators (http://www.ic.nhs.uk/nhscomparators )
Practice Profiles • 3 PHOs have developed profiles (LHO, YHPHO and ERPHO) • All similar in terms of content • Underlying handling of data is different • APHO currently working on roll out of profiles across all PHOs in England
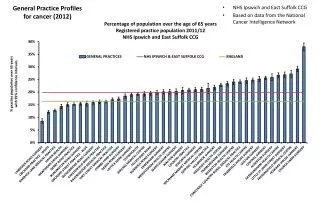
Content • Population • Demography & Patient Satisfaction • Cardiovascular disease • Diabetes • Mental health • Respiratory disease • Secondary care use • Prescribing • Other
Display • Population graphs/charts (LHO/ERPHO) • Spine charts (all) • Maps (YPHO) • Radar charts (YHPHO for geodemographic segmentation) • YHPHO include ‘clustering’
Challenges • Getting data (other than QOF) • Practice populations • Exeter NSTS • Attribution Dataset – GP lists reconciled with ONS resident populations • Practices have no geography so geographically defined indicators (like IMD) cause problems
The future? • Hopefully roll out of APHO national practice profiles in autumn (October) – subject to early access to QOF data • APHO profiles will be based on ERPHO model – printability and ability to cluster practices are important • Unclear how profiles might link/integrate into other products
Questions? john.battersby@erpho.org.uk