Download
1 / 34
340 likes | 448 Views
Earthquakes! Natural Disasters Unit Five. Earthquakes and the Earth's Interior. The movement of earthquake waves through the Earth’s interior has given us a better picture of the Earth’s interior.

E N D
Earthquakes! Natural Disasters Unit Five
Earthquakes and the Earth's Interior The movement of earthquake waves through the Earth’s interior has given us a better picture of the Earth’s interior.
P-waves are faster than S-waves. The density and elasticity of rock affects the speed of the waves. When P-waves hit the core, they are refracted and slow down. This creates a P-wave shadow 103º -143 º from the focus
S-waves can’t travel through liquids. When S-waves hit the outer liquid core, they stop. This creates a S-wave shadow at locations greater than 103º from the focus of the earthquake.
Speed of Seismic Waves: *Boundary between crust and upper mantle (Moho) *P-waves travel at 6.75 km/sec in the crust and 8 km/sec below this boundary. *The depth varies depending if it is under continents (20 - 90 km) or under ocean floors (5 to 10 km). *Speed also increases with depth in the mantle except for a low velocity zone at 100-250 km. This corresponds to the asthenosphere.
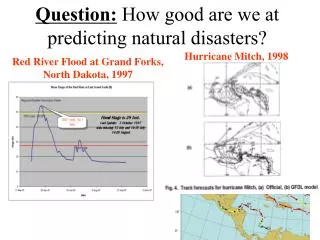
Determining an Earthquake's Epicenter • Focus: where “slippage” first occurs • Epicenter: directly above the focus on the Earth’s surface • The arrival times of P and S waves determines the distance to an earthquake
Where is the Epicenter? • The difference in arrival times of P and S waves determines the distance of the earthquake to a seismograph station. • A circle representing the distance is drawn around the station. • This is done with three stations, and where the circles cross is the exact location of the epicenter.
Earthquakes in the U.S. But they are clustered along the Pacific Coast. Why?
Movement along the San Andreas Fault • Tectonic Creep is the slow continuous movement along a fault zone that is not accompanied by felt earthquakes. • Locked faults are sections that are not moving (locked due to friction). Pressure builds up in these sections until it overcomes the friction and the energy is released in an earthquake (elastic rebound).
Offset fence Point Reyes
New Madrid Fault Zone • 150 miles long • Illinois, Missouri, Arkansas, Kentucky, Tennessee • Faults formed when N.A. began to split (failed) • Flooded by ancient sea (covered by sediment) • Thousands of E-Q since 1970’s • 1811-1812: 4 of largest NA major E-Qs felt
Depth: C-O and O-O Convergent Boundaries Two lithospheric plates come together • Yellow squares indicate earthquake depth • Oceanic plate subducts beneath continental (more dense) • Older oceanic plate subducts beneath younger oceanic plate • Shallow to deep earthquakes
Depth: C-C Convergent and Transform • No subduction occurs when a continent collides with another continent (same density); folding and buckling occurs along the continental margins • Shallow earthquakes • Transform boundaries (plates slide past one another) also create relatively shallow earthquakes
Depth: Divergent Boundaries • Plates separate • Mid-Atlantic Ridge (MAR) • New crust formed • Shallow earthquakes • Generally less frequent
Measuring Earthquake Intensity and Magnitude The strength of an earthquake can be measured in two different ways: Intensity: qualitative assessment of the extent of damage done by an earthquake; subjective; Modified Mercalli Intensity scale ( I to XII) Magnitude: quantitative measurement of the amount of energy released by an earthquake; Richter Magnitude scale (1 to 10); each step in the Richter Scale is an increase of 10-fold in movement and a 30-fold increase in energy
Fault Scarp -Central California scarp Linear valley Linear ridge Offset stream
Earthquake Damage depends on many factors: The size of the Earthquake (magnitude) The distance from the focus of the earthquake The types and properties of the materials at the site The nature of the building
Soil and Earthquake Damage: • Soil thickness: shallow soils may not perform as well as deep • Soil saturation: saturated soils perform less well than dry • Soil grain size and sorting: well-sorted, fine grained sands and silts are the most likely to liquefy • Types of bedrock: unweathered igneous rocks are better than weak fractured rock • Areas where ground may settle or slide • Nature of building and Earthquake Damage: • Type of construction (size and use of building) • Seismic design considerations • Architectural simplicity of building
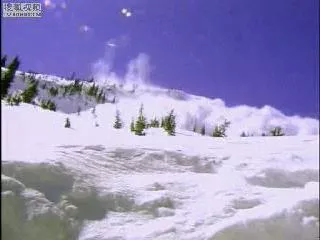
Landslides • Rock, earth or debris flows on slopes due to gravity • Major geologic hazard because widespread • $1-2 billions/year in damage • Fisheries, tourism, timber harvesting, mining and energy production impacted • As development , damage
Fire • Appliances, furniture and gas, chemical and electrical hazards present • Water pools can fire hazard • Leaking gas lines, damaged or leaking propane containers, and leaking gas tanks
San Francisco, 1906 • Earthquake struck at 5:13 AM • “Liquified” ground beneath the city exacerbated potential for fires • Fires burned for four days
Tsunamis • Occur when faulting or landslide occur on the ocean floor • Seafloor permanently uplifted or down-dropped, creating “sloshing” of water • Displaced water gains height as approaches shore • Floating debris and strong currents create damage
Indonesia, 12/26/2004 • Picture taken by newlyweds vacationing when tsunami stuck; both were killed when tsunami came inland • The destruction of coral reefs along shorelines (for shrimp “farms”) increased destruction from tsunami as waves took longer to “break”
Earthquake Prediction It is difficult to accurately predict earthquakes. Analysis of past earthquake patterns, measurement of movement, and the distribution of faults have allowed scientists to create seismic risk maps. Along the San Andreas fault, geologists are looking for areas along faults that are currently inactive. This probably means that these regions are locked and that energy is building up. Tilting of rocks on either side of fault-lines is also a sign of pressure build-up.
Earthquake risk in the Bay Area Green: Stable bedrock Orange: Unstable bedrock Yellow: Unconsolidated Soil Red: Mud and Fill