Download
1 / 82
870 likes | 1.31k Views
Chapter 3: Scientific Measurement. We often need to explain to others the items that we study and observe. We do this by classifying the items around us. In order to do this we must have a system of measures also used by others.

E N D
Chapter 3: Scientific Measurement • We often need to explain to others the items that we study and observe. • We do this by classifying the items around us. • In order to do this we must have a system of measures also used by others. • There are two different types of measures that chemists are concerned with in their studies.
Classification by Composition • A powerful way to classify matter is by its composition. This is the broadest type of classification. • When you examine an unknown piece of stuff, you first ask, “What is it made of?” • Sucrose is composed of the elements carbon, hydrogen, and oxygen. This is a qualitative expression of composition. • A qualitative observation is one that can be made without measurement.
Classification by Composition • After a qualitative analysis, the next question that you might ask is how much of each of the elements is present. • For sucrose, the answer to that question is that 100 g of sucrose contains 42.1 g of carbon, 51.4 g of oxygen, and 6.5 g of hydrogen. This is a quantitative expression of composition. • A quantitative observation is one that uses measurement.
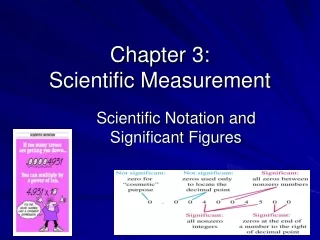
Scientific Notation • Scientific notation expresses numbers as a multiple of two factors: a number between 1 and10; and ten raised to a power, or exponent. • The exponent tells you how many times the first factor must be multiplied by ten. • When numbers larger than 1 are expressed in scientific notation, the power of ten is positive.
Scientific Notation • When numbers larger than 1 are expressed in scientific notation, the power of ten is positive. • When numbers smaller than 1 are expressed in scientific notation, the power of ten is negative.
Convert Data into Scientific Notation • Change the following data into scientific notation. • The diameter of the Sun is 1 392 000 km. B. The density of the Sun’s lower atmosphere is 0.000 000 028 g/cm3.
Move the decimal point to produce a factor between 1 and 10. Count the number of places the decimal point moved and the direction. Convert Data into Scientific Notation
Convert Data into Scientific Notation • Remove the extra zeros at the end or beginning of the factor. • Multiply the result by 10n where n equals the number of places moved. • Remember to add units to the answers.
Adding and Subtracting Using Scientific Notation • When adding or subtracting numbers written in scientific notation, you must be sure that the exponents are the same before doing the arithmetic. • Suppose you need to add 7.35 x 10² m + 2.43 x 10² m.
Adding and Subtracting Using Scientific Notation • You note that the quantities are expressed to the same power of ten. You can add 7.35 and 2.43 to get 9.78 x 10² m. • If the quantities are not expressed to the same power of ten, change one of the numbers to match the power of ten of the other number.
Multiplying and Dividing Using Scientific Notation • Multiplying and dividing also involve two steps, but in these cases the quantities being multiplied or divided do not have to have the same exponent. • For multiplication, you multiply the first factors.Then, you add the exponents. • For division, you divide the first factors. Then, you subtract the exponent of the divisor from the exponent of the dividend.
Multiplying and Dividing Numbers in Scientific Notation • Suppose you are asked to solve the following problems.
Accuracy and Precision • When scientists make measurements, they evaluate both the accuracy and the precision of the measurements. • Accuracy refers to how close a measured value is to an accepted value. • Precisionrefers to how close a series of measurements are to one another.
Accuracy and Precision • An archery target illustrates the difference between accuracy and precision.
Accuracy and Precision • An archery target illustrates the difference between accuracy and precision.
Percent error • To evaluate the accuracy of experimental data, you can calculate the difference between an experimental value and an accepted value. • The difference is called an error.
Percent error • Scientists want to know what percent of the accepted value an error represents. • Percent error is the ratio of an error to an accepted value.
Percent error • For this calculation, it does not matter whether the experimental value is larger or smaller than the accepted value. Only the size of the error matters. • When you calculate percent error, you ignore plus and minus signs.
Calculating Percent Error • Calculate the percent errors. Report your answers to two places after the decimal point.
Calculating Percent Error • Substitute each error into the percent error equation. Ignore the plus and minus signs. Note that the units for density cancel out.
Assessment Questions Question 1 Suppose you calculate your semester grade in chemistry as 90.1, but you receive a grade of 89.4. What is your percent error? Answer 0.783%
Assessment Questions Question 2 On a bathroom scale, a person always weighs 2.5 pounds less than on the scale at the doctor’s office. What is the percent error of the bathroom scale if the person’s actual weight is 125 pounds? Answer 2.00%
Significant Figures • Often, precision is limited by the available tools. • Scientists indicate the precision of measurements by the number of digits they report. • A value of 3.52 g is more precise than a value of 3.5 g.
Significant Figures • The digits that are reported are called significant figures. • Significant figuresinclude all known digits plus one estimated digit.
Rules for recognizing significant figures • Non-zero numbers are always significant. 72.3 g has three • Zeros between non-zero numbers are always significant. 60.5 g has three • All final zeros to the right of the decimal place are significant. 6.20 g has three
Rules for recognizing significant figures • Zeros that act as placeholders are not significant. Convert quantities to scientific notation to remove the placeholder zeros. 0.0253 g and 4320 g each have three • Counting numbers and defined constants have an infinite number of significant figures. 6 molecules 60 s = 1 min
Applying Significant Figure Rules • Determine the number of significant figures in the following masses.
has five significant figures. has three significant figures. Applying Significant Figure Rules • Count all non-zero numbers (rule 1), zeros between non-zero numbers (rule 2), and final zeros to the right of the decimal place (rule 3). Ignore zeros that act as placeholders (rule 4).
Rounding Off Numbers • Answers should have no more significant figures than the data with the fewest significant figures. • In the example for each rule, there are three significant figures.
Rules for Rounding Numbers • If the digit to the immediate right of the last significant figure is less than five, do not change the last significant figure. • If the digit to the immediate right of the last significant figure is greater than five, round up the last significant figure.
Rules for Rounding Numbers • If the digit to the immediate right of the last significant figure is equal to five and is followed by a nonzero digit, round up the last significant figure.
Rules for Rounding Numbers • If the digit to the immediate right of the last significant figure is equal to five and is not followed by a nonzero digit, look at the last significant figure. If it is an odd digit, round it up. If it is an even digit, do not round up.
Addition and Subtraction • When you add or subtract measurements, your answer must have the same number of digits to the right of the decimal point as the value with the fewest digits to the right of the decimal point. • The easiest way to solve addition and subtraction problems is to arrange the values so that the decimal points line up.
Addition and Subtraction • Then do the sum or subtraction. Identify the value with the fewest places after the decimal point. • Round the answer to the same number of places.
Applying Rounding Rules to Addition • Add the following measurements: 28.0 cm, 23.538 cm, and 25.68 cm. • Line up the measurements: • Because the digit immediately to the right of the last significant digit is less than 5, rule 1 applies. The answer is 77.2 cm.
Multiplication and Division • When you multiply or divide numbers, your answer must have the same number of significant figures as the measurement with the fewest significant figures.
Apply Rounding Rules to Multiplication • Calculate the volume of a rectangular object with the following dimensions: length = 3.65 cm width = 3.20 cm height = 2.05 cm
Apply Rounding Rules to Multiplication • To find the volume of a rectangular object, multiply the length times the width times the height. • Because the data have only three significant figures, the answer can have only three significant figures. • The answer is 23.9 cm3.
Graphing • Using data to create a graph can help to reveal a pattern if one exists. • A graphis a visual display of data.
Circle graphs • A circle graph is sometimes called a pie chart because it is divided into wedges like a pie or pizza. • A circle graph is useful for showing parts of a fixed whole. • The parts are usually labeled as percents with the circle as a whole representing 100%.
Bar graph • A bar graph often is used to show how a quantity varies with factors such as time, location, or temperature. • In those cases, the quantity being measured appears on the vertical axis (y-axis). • The independent variable appears on the horizontal axis (x-axis). • The relative heights of the bars show how the quantity varies.
Line Graphs • In chemistry, most graphs that you create and interpret will be line graphs. • The points on a line graph represent the intersection of data for two variables. • The dependent variable is plotted on the y-axis. • Remember that the independent variable is the variable that a scientist deliberately changes during an experiment.
Line Graphs • Sometimes points are scattered, the line cannot pass through all the data points. • The line must be drawn so that about as many points fall above the line as fall below it. • This line is called a best fit line.
Line Graphs • If the best fit line is straight, there is a linear relationship between the variables and the variables are directly related. • This relationship can be further described by the steepness, or slope, of the line. • If the line rises to the right, the slope is positive.
Line Graphs • A positive slope indicates that the dependent variable increases as the independent variable increases. • If the line sinks to the right, the slope is negative.
Line Graphs • A negative slope indicates that the dependent variable decreases as the independent variable increases. • Either way, the slope of the graph is constant. You can use the data points to calculate the slope of the line. • The slope is the change in y divided by the change in x.