Download
1 / 43
430 likes | 568 Views
The National Biological Information Infrastructure. Access to Environmental Information. What is the National Biological Information Infrastructure (NBII)?. Federal effort to establish standards, technologies, and partnerships to improve access to and exchange of biological information

E N D
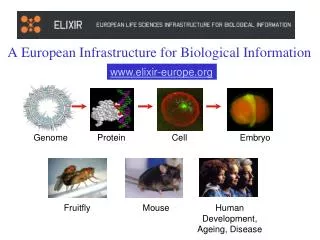
The National Biological Information Infrastructure Access to Environmental Information
What is the National Biological Information Infrastructure(NBII)? • Federal effort to establish standards, technologies, and partnerships to improve access to and exchange of biological information • Result of the Summit of the Americas Conference on Sustainable Development in 1996 and a PCAST Panel on Biodiversity and Ecosystems report, 1998 • WWW portal to environmental websites, databases, and experts • Emphasis on latest political topics
NBII incorporates multiple federal environmental information resources • Wildlife data • Audubon Christmas Counts • Breeding Bird Survey • Non-Indigenous Aquatic Species • Wildlife Diseases • Mapping • National Vegetation Map All in relational databases or GIS
Taxonomic Services • Integrated Taxonomic Information System (ITIS) • USDA Plants • Species 2000, Global Biodiversity Information Facility (GBIF) • Collaboration with museum community • Species Analyst
State Partnerships • Gap Analysis • Imagery • Vegetation maps • Habitat suitability for wildlife • Gaps in conservation coverage • Support for classification and metadata standards
International • U.S. lead for • Man and the Biosphere (UNESCO) • IABIN (Summit of the Americas) • NABIN (NAFTA) • GBIF • News flash – first World Data Centre for biological data • All have embraced SW technologies as a basis for international exchange (at least in principle)
Services • Access to federal databases • Topical news • Search facilities (e.g. Biobot) • Metadata standards • Thesaurus services (CSA)
Geographic Gulf Coast (Texas) Left Coast (California) Pacific Basin (Hawaii) Pacific Northwest Northern Rockies Southern Appalachians Southwest Thematic Avian Fisheries and watersheds Invasive Species Core Infrastructure Administration Network of “Nodes”
Vision & Objectives • Principles for environmental informatics based on distributed nodes: • Environmental information generally should be managed at its source • Core data (“Darwin Core”) should be transparently shared, idiosyncratic data should be discoverable
Fish University of Florida
Fish University of Florida detail
Fish Tulane University
Fish University of Michigan
Fish “World Museum”
Principles (2) • Sharing requires shared vocabularies • Taxonomy -- ITIS • Subject -- LOC, CERES • Geolocation • Methodology • Vocabularies are user-community specific • Natural extensions to XML, data mining technologies
Principles (3) • Incentives to share • Tools • Publication and professional recognition • Peer review • Danger: Garbage In, Gospel Out
The NBII California Information Node Project (CAIN) Information Technology for Invasive Species Researchers and Managers
Multinational: MAB IABIN NABIN GISP Mexico: CONABIO, UNAM Brazil: Base de Dados Tropical Venezuela: Universidad Central de Venezuela Russia Komarov Botanical Institute United States: USGS International Programs USGS Nonindigenous Aquatic Species Program Smithsonian Environmental Research Center Hawaiian Ecosystems at Risk Project NHM & Biodiversity Research Center, University of Kansas California: California Biodiversity Council California Exotic Plant Pest Council California Food & Agriculture California Department of Transportation Friends and Colleagues
California Node Ongoing Funding Partnerships/Infrastructure USGS (BRD, FGDC) US EPA (Center for Ecological Health Research) NSF (PACI, STAR) NASA Center of Excellence CalFed Bay-Delta Program USDA (NRCS) California Biodiversity Council California Environmental Protection Agency California Department of Transportation
Invasive Species: The Top Environmental Issue of the 21st Century • Economic costs ($138 Billion/year). • Environmental costs (40% of Threatened and Endangered Species, many native species declines). • Human-health costs (West Nile Virus, Aids, malaria, others on the way). • Increased unintentional spread, or threat of ecological terrorism(hoof-and-mouth, mad cow disease, crop pathogens). Notorious examples include Dutch elm disease, chestnut blight, and purple loosestrife in the northeast; kudzu, Brazilian peppertree, water hyacinth, nutria, and fire ants in the southeast; zebra mussels, leafy spurge, and Asian long-horn beetles in the Midwest; salt cedar, Russian olive, and Africanized bees in the southwest; yellow star thistle, European wild oats, oak wilt disease, Asian clams, and white pine blister rust in California; cheatgrass, various knapweeds and thistles in the Great Basin; whirling disease of salmonids in the northwest; hundreds of invasive species from microbes to mammals in Hawaii; and the brown tree snake in Guam. Hundreds new each year!
Fire stimulators and cycle disruptors Water depleters Disease causers Crop decimators Forest destroyers Fisheries disruptors Impeders of navigation Clogger of water works Destroyer of homes and gardens Grazing land destroyers Noise polluters Species eliminators Modifiers of evolution What invasives are: GISP
Data Synergies: inputs for early detection, risk assessment, and “ecological forecasting” models
California Invasive Species Information System (CRISIS):Client Products • Interactive Mapping • Alert Systems- new sightings of potentially invasive species • e.g., GISP, FICMNW • Prediction of invasive species spread • Data Mining • Oak Ridge Mercury Center
Important Information Types • Experts • Organizations • Species lists by organization • Data resources • Projects • Fact sheets • Occurrence data
Inquiries to support • What is this? • What kind of problem is it? • Where else is it a problem? • What are its vectors and pathways? • Who knows something about it? • Where might it go next? • What are effective management methods?
Interpretation clients Online Mapping Prediction Alert Classify Model Shared data Experts Occurrences Images Outcomes Extract Reward! Abstract P h o t o University Border Inspection Providers NGO Museum
Services needed: Identification aides • Polyclave keys – language appropriate – • It’s big • It’s green • It’s ugly • It’s…
Team Arundo del NorteMapping and Digital Library Effort Needed: Digital fieldform technology Objectives: • Develop a standard methodology for collecting weed field data • train local projects in its use • Share data across many watershed groups
Needs: Assessing trust in citizen observations • Museum expert or Mrs. Smith’s 3rd grade class? (Ag commissioners, native plant societies…) • Documentation (e.g. digital photos) • Annotation methods (ex: CalFlora) • Estimating reliability from subsequent use?
Web Services • Early warning systems • Risk assessments • Distributional mapping
What do clients want? • Pick and click on any • point, land management • unit, county, state, or • region and determine • The current invasion, • and vulnerability to • future invasion by many • species. • (help public and private • land managers).
Distributed Web-net
ArcGIS: Input satellite data, veg., soils, topography, etc. Field Data: Invasive species data, veg., soils, topography, etc. 1. S-Plus: Develop Multivariate Model,screen and normalize data, test for tolerance/multi-colinearity, and run stepwise regression. 2. S-Plus: test residuals for auto-correlation and cross-correlation (Morans-I) and find the best model (ordinary least squares, gausian, etc. using AICC criteria). 3. 4. S-Plus/Fortran: If spatially autocorrelated, run kriging or co-kriging models. ArcInfo GIS: develop map of model uncertainty from S-Plus output, Monte-Carlo simulations, observed-expected values. 5. ArcView: produce maps of current distributions, potential distributions, and vulnerable habitats, with known levels of uncertainty. 6. Current Predictive Modeling Capabilities
Future “Ecological Forecasting” Models: Far more automated, instantaneous, and continuous! ArcView: Input satellite data, via new sensors or change detection models. Field Data: Early detection or monitoring data, from many sources. 1. OR 2. • Web-ware: • Develop multivariate model, screen and normalize data, test for tolerance/multi-colinearity, and run combinatorial screening. • Test residuals for auto-correlation and cross-correlation (Morans-I) and find the best models. • If spatial autocorrelation exists, run kriging or co-kriging models. • Develop map of models uncertainty (maps with standard errors). • Produce maps of current distributions, potential distributions, and vulnerable habitats, with known levels of uncertainty. 3. Repeat Step 1 – always be looking for new data
Or . . . Pick and click on any species or group of species, and get current distributions, potential distributions, potential rates of change, and levels of uncertainty. (We have much to learn here! HPCC example on West Nile Virus).