Download
1 / 23
230 likes | 363 Views
Stellar populations in high redshift Ly-alpha emitters. L. Pentericci A.Grazian , A. Fontana (INAF-ROME) ( paper will appear on astroph in the next few days ). HEIDELBERG 08/10/2008. LAEs and LBGs : same galaxies or diffrent populations ??.

E N D
Stellar populations in high redshiftLy-alphaemitters L. Pentericci A.Grazian, A. Fontana (INAF-ROME) ( paperwillappear on astroph in the nextfewdays) HEIDELBERG 08/10/2008
LAEs and LBGs: samegalaxies or diffrentpopulations ?? • A meaningfulcomparisontounderstand the connection between the twopopulationsshould include the physicalpropertiesofgalaxies (total stellar mass, age, SFR and SF histories …) ForLBGsmanystudiesexistfrom low to high redshift: z ≈2: 6x 10¹⁰M⊙(Erbet al. 06); z ≈3: u-dropouts 3-400 Mys , 1010M⊙(Shapleyet al 01, Papovichet al. 01, Iwataet al. 05, Rigopoulouet al. 06); z ≈ 4: B-dropouts 2-300 Myrs 109 -1010M⊙ ( Pentericciet al. 07); z ≈ 5: V-dropouts: 100 Myrs , few x109 M⊙(Vermaet al. 07); z ≈6: i-dropouts (Yanet al. 06, Eyleset al. 05, Egamiet al. 05); ……andmanyothers…………
Fornarrow band selectedLAEsfewer stellar population studiesexist(Lai et al. 2006, Gawiseret al. 06, Pirzkalet al 2007 Finkelsteinet al. 07,08) GENERAL PICTURE : • Ages : 10-100 Myrs • Massestypically ≈108 M⊙ but some as low as 107 M⊙ • No extinction YOUNGER, LESS MASSIVE, LESS DUSTY THAN LBGsat similarredshift However!!! • FewLAEshavebeenobserved in the mid-IRwhichisessentialtoconstrain the masses (e.g. Fontana et al. 06) • Fewsampleshavegoodnear-IR data which are requiredto break SED modeldegeneracy (e.g. youngdustypopulation vs olddust-freepopulation) • Moststudiesrely on stackedanalysis i.e. derive onlyaverageages and massesof the entire sample.
Toovercometheselimitations in the analysisof LAE stellar populations, westudyLyαemittinggalaxiesthathavebeenselectedfromtheir continuum propertiesasLBGs We take advantageof the large area, depth and excellentmultivawelengthspectralcoverageof the GOODS survey (Dickinson et al. 04, Giavaliscoet al. 04)
Sample ofLBGswithLyα in emissionselectedfromGOODS-Southfield • Galaxieswereselectedfrom the GOODS-MUSIC z-detected sample (Grazianet al. 06) as B,V and i dropouts (color selectionas in Giavaliscoet al. 04) • Wethenselectedgalaxieswithpublishedspectroscopicconfirmationmostlyfrom GOODS/FORS (Vanzellaet al. 05,06,08) or otherpapers • OnlyobjectswithLyαline in emissionwereretained • No AGNswereincluded (no X emis.)
Sample ofLBGswithLyα in emissionselectedfromGOODS-Southfield • Galaxieswereselectedfrom the GOODS-MUSIC z-detected sample (Grazianet al. 06) as B,V and i dropouts (color selectionas in Giavaliscoet al. 04) • Wethenselectedgalaxieswithpublishedspectroscopicconfirmationmostlyfrom GOODS/FORS (Vanzellaet al. 06,07) or otherpapers • OnlyobjectswithLyαline in emissionwereretained • No AGNswereincluded (no X emis.)
Sample ofLBGswithLyα in emissionselectedfromGOODS-Southfield • Galaxieswereselectedfrom the GOODS-MUSIC z-detected sample (Grazianet al. 06) as B,V and i dropouts (color selectionas in Giavaliscoet al. 04) • Wethenselectedgalaxieswithpublishedspectroscopicconfirmationmostlyfrom GOODS/FORS (Vanzellaet al. 06,07) or otherpapers • OnlyobjectswithLyαline in emissionwereretained • No AGNswereincluded (no X emis.)
Redshift and EW distribution Redshiftdistributionshowing the B , V and i dropouts: ≈70 galaxies Restframe EW distribution: • > 50% has EW0largerthan 20Å so theywouldbeselectedasLyαemitters in narrow band surveys • Forcomparisonwe plot the LBGs sample byTapkenet al. 07 (continuum selected) at z=3-5 (green histogram) and the 22 LyαemittersfromFinkelsteinet al. 07 at z=4.5 whichhavedetectionsalso in at least 2 continuum bands ( redhistogram)
GOODS – MUSIC catalogue The full multi-wavelength information consistingof 14 bandsphotometry (VIMOS /2.2-WFI U, HST/ACS BVIz , VLT/ISAAC JHK, IRAC 3.6, 4.5,5.8,8 μ) wasretrievedfrom the GOODS-MUSIC catalog (Grazianet al. 06) whichuses the ConvPhotalgorithm (DeSantiset al. 07) to match PSFsfrom the differentinstruments Mostof the galaxies are detected in allbands (above the Lyman break) and in particularmosthavenear-IR and/or IRAC detections Thisimpliesthatwe can determinephysicalpropertiesofindividualgalaxieswithoutstacking the sample
Stellar populationmodels BRUZUAL & CHARLOT (2003) CHARLOT & BRUZUAL (2007) MODEL PARAMETERS: • Salpeter IMF between 0.1 and 65 M⊙ • SFR: exponentiallydecliningwithe-foldingtime τ =0.1,0.3,0.6,1,2,3,5,9,15 • Dustextinction: Calzetti or SMC law E(B-V)=0,0.03,0.06 then 0.1-1.1 (in binsof 0.05) • Metallicity : 0.02-0.2,1,2.5 solar • Age : <ageofuniverse at thatredshift OUTPUT • Total stellar masses (withuncertaintiesreducedthanksto the inclusionof the 4 IRAC bands e.g. Fontana et al. 06) • continuum based SFR • best fit stellar ages, E(B-V), metallicity , tau…
The fits are wellconstrainedformostof the galaxies Forgalaxieswith EW> 20 Å, a secondfitwasperformedexcluding the band thatcontains the Lyαline: thesefitsgivetotallycomparableresults. Thisimpliesthat • The fits are robust and do notdepend on the single band • The propertieswe derive do notdepend on the presenceoflineemission • NB: The resultsobtainedwith the new Charlot & Bruzual (2007) • models are similar: • the masses are lowerby a 25% factor • the ages are youngerby 20% • Differences are systematic allmainresults and correlation are • alsovalid
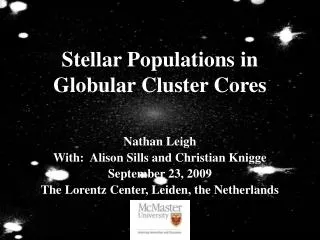
IncreasingAge Increasing Stellar Mass
IncreasingAge Redshift 3.79 Mass=6.3 x 10⁸ M⊙ Age= 10 Myrs Increasing Stellar Mass
IncreasingAge Redshift 4.2 Mass=3 x 10¹⁰ M⊙ Age=510 Myrs Increasing Stellar Mass
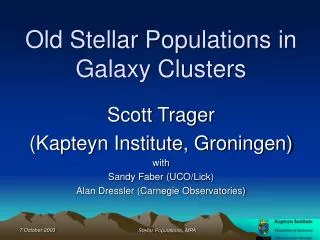
Ages: oldLyαemitters? • Agedistributionisshown: best fitvalues (black) and the sum of the ProbabilityDistributionfunctionofeachgalaxy (red) • Subsamplewith EW0 > 20 A isshown in green • Mostgalaxies are modeledwithveryyoung stellar populations (T= 10-200 Mys) asexpected and comparabletowhatfoundby NB selectedLAEs • 13/68 galaxieshave best fitages > 0.5 Gyrs & Agemin > 300 Myrs so they are mostcertainlynotprimevalgalaxies. OLD
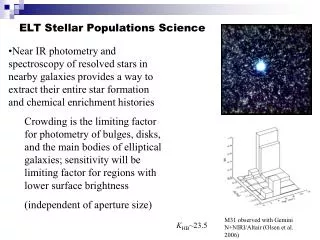
ExamplesofoldLyαemitters Theseobjectsclearly show a prominentBalmer break: SED modellinggiveslarge best fitages (1.1 Gyr & 0.7 Gyr) Considerablyyoungermodels can beruled out with high confidence Bothofthem are brightLyαemitterswith EW >> 20 Å
OldLyαemitters The Agedistributionof the EW>20 subsampleisconsistentwiththatof the entire sample MedianAge =300 Myr Median Age=250 Myrfor sub-sample with EW>20 Å (with some galaxieshavingages ≈ 1 Gyr • some evolvedgalaxiesshouldbeobserved also in NB selectedsamples : where are they??? Perhapsextremeproperties are notfound in largesamplesbecauseofstackedphotometrymethod: the fewoldgalaxies are “diluted” in the more numerousyoungpopulation Alsomost NB surveyslackgood data coverage in the regionaround 4000 Å restframewhichiscrucialto reduce modeldegeneracies In the mostrecent work ofFinkelsteinet al. (2008) found 2 out of 15 LAEswithagesaround 700 Mys
Q. How can weobservebrightLyαemissionfromevolved stellar populations ? • A clumpydusty ISM can actuallyenhanceLyα EW byselectivelysuppressing the continuum more than the Lyαphotons (see talk byFinkelstein ) • In (some) oldergalaxiesdustcouldhavebeendestroyed or sweptawayby gas outflows so the Lyαphotons can againescapefreely (e.g. Shapleyet al. 03) • Type II LAEs (see talk byShimizu) • Other….
Total stellar masses Masses are in the range 108.5 -10 11 M⊙ Median stellar mass≈ 6 x 10⁹ M⊙ 4 x 10⁹ M⊙for EW>20 Å subsamplehigherthanmostotherestimatesforLAEs at redshift 3-6 (Pirzkalet al. 07 Finkelsteinet al. 07 Gawiseret al. 06) Significantlackof massive galaxieswithlarge EW Thiscouldexplain the lackof massive objects in samplesof NB selectedLyαemitters: thistechniquetendstopickobjectswithvery high EW—muchlargerthan the nominal cut of 20 Å
Q.Why do massive galaxieslackbrightLyαemission? • Notanobservationalbias • Massive galaxiescouldbe more dusty (e.g. Schaerer & Verhamme) notobserved in our data • Massive galaxiesreside in most massive DM halos and thereforecouldbecontainlargeramountsofneutral gas (Steidelet al.) • Massive galaxiescontainoutflowingneutral gas thathaslargervelocitydispersion and can depresspartially the Lyαline, alsoresulting in more asymmetricprofiles (e.g. Tapkenet al. 2007,Ahnet al. 01)
Dustcontent: The presenceofdust (although in smallamounts) isrequiredby the SED fitsofmanygalaxies E(B-V) ≠ 0 forhalfof the galaxies. Thereis a significantcorrelationbetween E(B-V) determinedfrom the continuum fit and the Lyα EW from the spectra. In agreement withShapleyet al.(03) forLBGs at z=3 and withPentericciet al. (07) forLBGs at z=4 whofindthatLBGswithout lineemission are dustierthan LBGswithlineemission A scenario whereallLBGs are intrinsicLyαemitters and dustsuppress the emissionhasbeenrecentlyproposedbySchaerer & Verhamme (07) and couldexplain some of the observedtrends
In summary…. • MostLyαemitters are extremelyyounggalaxiesbut a non negligiblefractioncontainsanevolved stellar population: • The derivedmasses are largerthanthoseofNB-selectedgalaxies • Thereis a lackof massive galaxieswithlarge EW • Thereis a strong correlationbetweenline EW and dustextinction also (resultsnotshown in this talk) • Masses and SFRs are in broadaccordancewithmodelpredictions • SFR estimatedfrom UV continuum > than SFR fromlineemission
Thereis a continuousrangeofphysicalpropertiesbetweenLAEs and LBGs • The smallerinferredmassesof NB selectedsamplesis due to the observed trend mass-EW • The lackofoldgalaxies in NB selectedsamplescouldbe due tolackofpropernear/mid-IRobservationstoconstrainmodels and/or to “dilution” of the smallfractionofoldobjects in the more numerousyounggalaxies • Unificationbetween the twopopulationisnotsimplyLAEs=youngLBG=oldergalaxiesbutprobablyrequiresothervariables, includingamount and distributionofdustamount and kinematicsofneutral gas, viewing angle etcetc