Download
1 / 35
350 likes | 502 Views
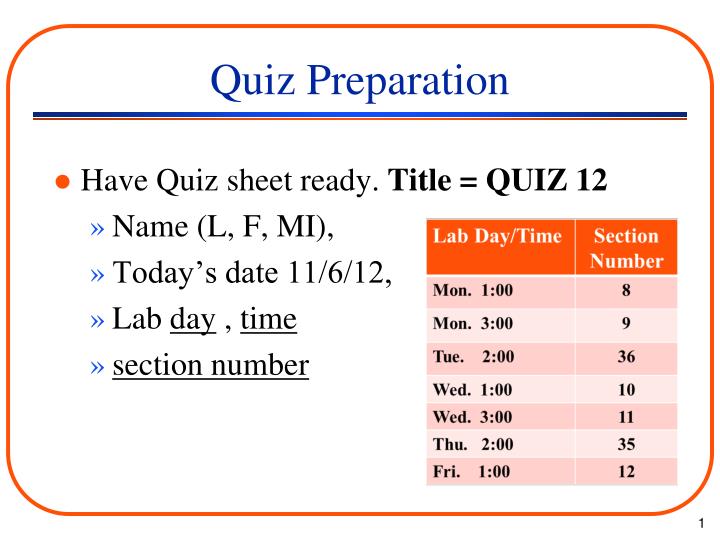
Quiz Preparation. Have Quiz sheet ready. Title = QUIZ 12 Name (L, F, MI), Today’s date 11/6/12, Lab day , time section number. Announcements. Competition is this Thursday (11/8). Meet in Broun 125. Runs start at 7:00 p.m. Come early if possible.

E N D
Quiz Preparation • Have Quiz sheet ready. Title = QUIZ 12 • Name (L, F, MI), • Today’s date 11/6/12, • Lab day , time • section number
Announcements • Competition is this Thursday (11/8). Meet in Broun 125. Runs start at 7:00 p.m. Come early if possible. • There is no lab activity this week except for the competition.
Major Changes • No oral presentations. These will be replaced by Quad Charts. • All sections have the following three items due by noon on 11/27: • Quad Charts • PDM 2 • Final design report
Quad Charts • Discussed in more detail next week • Each team will prepare a Quad Chart according to the format that will be provided. Look for a forthcoming email & posting on the public class website. • Quad Chart score will substitute for the oral presentation.
TASK Jan Feb Mar Apr Cost Task 1 (Describe) Task 2 Task 3 Subcontracts Final Report Admin Etc. Total (Initial or Final) Quad ChartProject Title Insert Graphic Here Photograph, artist’s rendering, flow chart, or other graphic to convey the main concept of the project; add minimal explanatory text if required. • OBJECTIVES - METHODS • Describe the new and unproven technology to be exploited. • From a technical perspective, why is this important to do now? • Describe how the research will be conducted and how the technology will be tested (add scenarios, if applicable). • Project team, if appropriate. • Describe performance metrics to be met. • Describe project deliverables. • APPLICATIONS - TRANSITION • Describe the maritime military value and operational improvement. • To whom is it important (e.g., potential military sponsor /user of the capability)? • What is the intended application for the result (e.g., commercialization)? • Why is the effort important? • Anticipated or actual results. • Estimated Technology Readiness Level (TRL). SCHEDULE & BUDGET Substitute a simple Gantt chart showing timelines, milestones, and costs by work task. Insert date Company: Acme Widgets Inc. Contact: John Q. Public Email: jqp@acme.com Phone: 803.123.4567
Announcements • There is no final exam for this course. • Tuesday 11/27 will be our last meeting for the course. There is no lab that week after the lecture. • Course evaluations are performed online.
Announcements • For lecture meetings 13 and 14, prepare ahead by (a) reading Chapter 19 and (b) thinking about ethical issues you have dealt with.
Final Design Report • Similar to Preliminary Design Report • Based on FINAL design • Follow the format on the class website, and incorporate the feedback I provided on your preliminary report. • Describe alternatives considered • Justify your design decisions • Use quantitative data if possible
Rubrics • A rubric is an explicit set of criteria used for assessing a particular type of work or performance. • Oral and Written Report Rubrics are on class website.
Financial Engineering • Recent feedback from E&CE Industrial Advisory Board: “Every E&CE graduate needs to understand engineering economics.” • Important part of professional engineer license -- Fundamentals of Engineering exam • INSY 3600 – Engineering Economy
Financial Engineering • Accounting • Recording and summarizing financial transactions • Cost accounting • Engineering economy • Economic analysis used to make decisions that have effects on current and future financial transactions
Economic Decision-Making • If and when should a piece of equipment, facility, or process be replaced? • Is one machine or process more economical than another? • Is a specific product profitable in the long-run? • Which products should be stored in inventory and where?
Accounting • Asset = anything of monetary value • Liability = debt that the company owes • Net worth = ownership interest in the company = capital stock + retained earnings • Revenue = income due to the sale of a product or service • Expense = expenditure for operations
Accounting • Balance sheet • Assets, liabilities, net worth • Income statement • Revenues, expenses, net profit
Cost Accounting • Variable costs • Direct material • Direct labor • Fixed costs (overhead) • Equipment, facility, tooling • Cost allocation • Based on variable cost • Based on activity
Cost Accounting Example • Part A (a PC motherboard) requires: • one hour of labor @ $40/hr. • $50 in parts. • Part B (a smartphone board) requires: • 0.2 hours of labor @ $40/hr. • $35 in parts. • Both parts use the production machinery costing $80,000,000 50% of the time. • 100,000 of Part A and 500,000 of Part B are made.
Variable Costs • Part A: • $50+$40=$90 per part • 90*100,000 = $9M total variable cost • Part B: • 0.2*($40)+$35=$43 per part • 43*500,000 = $21.5M total variable cost
Fixed Costs • Usual approach is % allocation of variable costs: • Part A % = (Part A variable)/(Total variable) =9/30.5= 29.5% • Part B % = (Part B variable)/(Total variable) = 21.5/30.5=70.5% • Fixed costs on this basis: • Part A = 0.295*$80M = $23.6M • Part B = 0.705*$80M = $56.4M • This is not a very good estimate of actual cost, since both parts use the machine 50%.
Activity-Based Costing • Allocate costs based on actual use: • In the previous example, split the fixed cost of the machine 50/50, since both parts use the machine equally: • Total costs: • Part A = $9M + $40M = $49M • Part B = $21.5M + $40M = $61.5M
Unit Costs • Unit cost = Total cost/ # of units • Activity-based costing • Part A unit cost = $49M/100,000 = $490 • Part B unit cost = $61.5M/500,000 = $123 • Percent of variable costs • Part A unit cost = $32.6M/100,000 = $326 • Part B unit cost = $77.9M/500,000 = $156 • There are some tricky aspects of this -- what if machine had to be purchased for one part regardless?
Time Value of Money • Would you rather have $100,000 now or $104,000 a year from now? • Is it cheaper to replace a labor-intensive process with an automated one? • Is it cheaper to buy or lease a piece of equipment?
Time Value of Money • P = present value • F = future value • A = total payment spread evenly over n years • i = annual interest rate (rate of return) • n = number of years
Cash Flow Diagram Income 40,000 1,000 1,000 1,000 0 3 5 4 1 2 8,000 4,000 i = 6% Expenditures
Time Value • Single-payment compound amount • Present value of a future cash flow • Example: F=$1,000 i=6% n=1 • P=1000*(1+0.06)-1=$943
Cash Flow Diagram i = 6% 40,000 1,000 1,000 1,000 0 3 5 4 1 2 $934 $890 8,000 4,000 -$3359 $792 $29890 $37147
Example • Rate of return is 12%; time horizon is 5 years: 1. Current manual process costs $10,000 per year. 2. Machine A costs $30,000 to purchase with $2,000 per year operating cost. Salvage value at the end of five years is zero. 3. Machine B costs $40,000 now and $1,000 per year to operate. At the end of 5 years it will be worth $9,000.
Example • Simply adding up the cash flow values for each alternative is not a valid comparison. • Need to convert all dollars to same time for valid comparison. • Usually convert to present value (PV).
Example • Alternative 1: Net Present Value (NPV) +0 +10,000*(1.12)-1 +10,000*(1.12)-2 +10,000*(1.12)-3 +10,000*(1.12)-4 +10,000*(1.12)-5 36,048
Example • Alternative 2: Net Present Value (NPV) +30,000 +2,000*(1.12)-1 +2,000*(1.12)-2 +2,000*(1.12)-3 +2,000*(1.12)-4 +2,000*(1.12)-5 37,210
Example • Alternative 3: Net Present Value (NPV) +40,000 +1,000*(1.12)-1 +1,000*(1.12)-2 +1,000*(1.12)-3 +1,000*(1.12)-4 +1,000*(1.12)-5 -9,000*(1.12)-5 38,498
Example Comparison Alternative Cash Flow NPV 1 50,000 36,048 2 40,000 37,210 3 36,000 38,498 • Conclusion: Alternative 1 has the best cash flow but the worst NPV. Choose #3. Excel File
Excel’s Financial Functions • FV( ) • NPV( ) • PV( ) • PMT( )
Quiz Preparation • Have Quiz sheet ready. Title = QUIZ 12 • Name (L, F, MI), • Today’s date 11/6/12, • Lab day , time • section number
Quiz 12 (answers) Quiz scoring: 3 points each answer, 25 points total • 1. The usual method of converting all dollars to the same time for valid comparison is called net __present_ value • 2. Anything of monetary value is called a(n) ___asset___ • 3. Anything debt the company owes is called a(n) ___liability_____