Download
1 / 9
90 likes | 204 Views
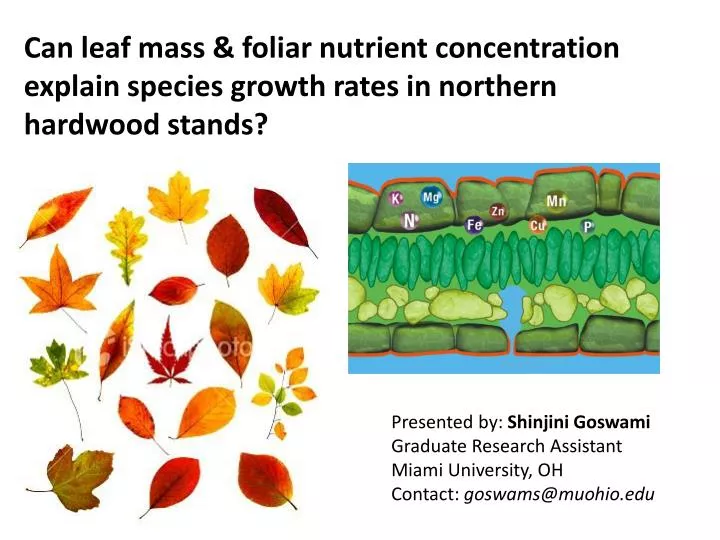
Can leaf mass & foliar nutrient concentration explain species growth rates in northern hardwood stands?. Presented by: Shinjini Goswami Graduate Research Assistant Miami University, OH Contact: goswams@muohio.edu. Co-limitation. Can arise in couple ways-

E N D
Can leaf mass & foliar nutrient concentration explain species growth rates in northern hardwood stands? Presented by: ShinjiniGoswami Graduate Research Assistant Miami University, OH Contact: goswams@muohio.edu
Co-limitation • Can arise in couple ways- 1. Productivity of all trees respond additively to N+P additions OR 2. Productivity of one species might respond to N whereas another might respond to P: Community level co-limitation • Broad question- Species specific growth responses to nutrient availability N or P or Ca or all????
Introduction • Growth efficiency- Trees with high efficiency accumulate more biomass per unit leaf mass • Measured as productivity per unit leaf mass • Expect it to increase with availability of the limiting nutrient • Foliar N:P ratios indicate nutrient limitations &/or co-limitation; <10 indicates N limitation and >20 indicates P limitation Koerselman 1996, Gusewell 2004 • If species differ in growth efficiencies relative to different nutrients, could contribute to co-limitation
Foliar N:P by species in mid and old stands (different nutrient status) Green- mid Red- old No specific pattern
I hypothesize that Yellow Birch is limited by N in the old stands.
Conclusions • Trends suggest Beech growth efficiency is limited by P, and Yellow Birch efficiency is limited by N • Species specific traits may indicate co-limitation • With the fertilizer treatments we are testing whether nutrient additions indicate co-limitation