Download
1 / 27
270 likes | 431 Views
Element Fluxes and Cycling in Marine Particles During VERTIGO 2004: Preliminary Results. Carl Lamborg, Ken Buesseler, Jim Valdes, Tom Trull, Jim Bishop, Karen Casciotti, Steve Pike, John Andrews, Steve Manganini, Chanda Bertrand and Dave Schneider. WHOI ICPMS Facility.

E N D
Element Fluxes and Cycling in Marine Particles During VERTIGO 2004: Preliminary Results Carl Lamborg, Ken Buesseler, Jim Valdes, Tom Trull, Jim Bishop, Karen Casciotti, Steve Pike, John Andrews, Steve Manganini, Chanda Bertrand and Dave Schneider WHOI ICPMS Facility Thanks to: Captain and crew of R/V Kilo Moana, Science Party of KM0414, Lary Ball, Suilou Huang,Mak Saito,Matt Charrette, Meagan Gonneea, Brian Guest, NSF-OCE, WHOI Post-doctoral Scholar Program (esp. John Farrington, Janet Fields and Christine Charrette), Penzance Endowed Discretionary Fund. near Station ALOHA
Introduction to VERTIGO • Our Interests in Element Fluxes and Cycling • VERTIGO 2004 (North Central Pacific Ocean) • Methods • Fluxes • How Accurate? Solubilization of Poisoned Trap Materials • Remineralization. Unpoisoned Incubations • Remineralization Time and Space Length Scales…Factors Affecting Flux Attenuation • Summary/Implications
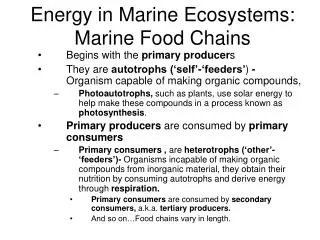
At the heart of VERTIGO is the question: • What controls the efficiency of particle transport between the surface and deep ocean? • There is an obvious mismatch between spatial patterns in primary production and the export of carbon to the deep ocean that indicates a complex suite of transformations must occur in the “twilight zone”, the region below the surface euphotic zone and the deep ocean. C uptake in surface ocean-SeaWiFS global primary production. Behrenfeld & Falkowski, 1997 C flux to seafloor -benthic O2 demand. Jahnke, 1996
Sinking Marine Particles – detritus from the euphotic zone and lithogenic material Swimmers Conventionally studied using shallow “sediment” traps, at the base of euphotic zone (100-150 m)
The VERTIGO P.I.’s have identified two general mechanistic possibilities: • particle source characteristics are the dominant control on the efficiency of particle transport. • mid-water processing, either by zooplankton or bacteria, controls transport efficiency. and/or
The Twilight Zone is Undersampled! This is likely to be where a lot of the action is…but few data. A compilation of all particle flux vs. depth data available from the last decade of JGOFS studies (redrawn from Berelson, 2001; not all shallow data plotted). Solid line is Martin curve for POC with b=-0.858.
Our Interests in Element Fluxes and Cycling • Fluxes for many elements other than C, N and P are not well known…especially in the top 500m. • e.g., Fe flux data lacking…fundamental information for understanding micronutrient cycling, and efficacy of Fe fertilization… • Multi-element determinations may provide multiple tracers to constraining rates of particle remineralization, variable sinking rates (particle dispersion), and sources. • biomineral and crustal elements in particular, in conjunction with other fluxes… • Additional tests on Th-derived approach to calculating POC fluxes. • e.g., will (Fe/234Th)part when combined with 234Th deficits match collections in sediment traps?
Gadgets! CLAP Trap- Buesseler MULVFS- Bishop NBST-Valdes Splitter MOCNESS-UNOLS/Steinberg IRS Trap-Trull
screen, combine, split, filter screen, combine, split, filter screen, combine, split, filter filters dried, stored frozen filters dried, stored frozen filters dried, stored frozen 1 Ag (d#1) or 1 nucl. (d#2) filtrate 1 Ag (d#1) or 1 nucl. (d#2) filtrate 1 Ag (d#1) or 1 nucl. (d#2) filtrate “Clap” Traps surface tethered, drogued arrays Consists of 10 tubes on each drifting array. Deployed at 3 depths: 150, 300 and 500m 2 tubes poisoned w/ HgCl2 2 tubes preserved w/formalin 1 tube covered blank 2 tubes aging expts. 1st HgCl2; 2nd formalin 2 tube Trull’s Gels 1 tube preserved w/formalin biological i.d. work NBSTs 3 deployed @ 150 m, 2 @ 300 m and 2 @ 500m. Consists of 5 tubes on each array.
Accuracy Issue: Solubilization of material in the sediment traps lowers estimate of flux. • some also believe “interstitial fluids” are an important component of flux…becoming enriched during sinking. squeezed out during processing (e.g., Avan Antia). From incubation experiments, one acquires the value of k, the remineralization rate constant slope=F slope=F’
1d 3d 5d 30d t = VERTIGO Poisoned Particulate Solubilization Experiments 1. brine/particle mixture collected from 2 combined sediment tubes designated for incubation experiments. experiments conducted with samples from 150, 300 and 500m. poisons change with deployment. 2. mixture split 8 ways on splitter, into 500 mL bottles. 3. splits combined. samples incubated at in-situ temperature 4. at pre-determined times, incubation bottle filtered on 0.2 µm PC, with liquid subsamples for ICPMS and DOC. half PC filter washed onto Ag filter for PC/PN/PP/bSi. filters dried and frozen.
Poisoned Solubilization Rates k = 0.1 d-1 suggests correction of 15-27%. In general, modest corrections needed from in-trap remineralization.
HOTS Primary Production June ’04: 531 mg C m-2 d-1 August ’04: 539 mg C m-2 d-1 f-ratio: 0.04 Deep Trap Limit (Karl, unpublished)
Though there’s variability in the absolute magnitude in the traps…the particles do not appear to be sorting very much…they index pretty well. The organic matter is decaying as one would expect. Makes up about 60% of attenuating mass. The zero OM endmember is 4 g m-2 y-1…average dust flux is 0.5 g m-2 y-1. red=150m green=300m blue=500m open=NBST closed=CLAP
red=CLAP blue=NBST average dust Al flux
red=150m green=300m blue=500m open=NBST closed=CLAP
Summary of Flux Measurements • No statistically significant difference between poisons. • Little difference between CLAP and NBST for most elements...suggests little hydrodynamic particle sorting and/or systematic under/oversampling.
The Martin Curve Paraphrasing Tom Trull from the VERTIGO website…it’s the Law, but is it a good Idea? Does it fit the data any better than other functional forms, for instance that proposed by Lutz et al. (2002): If flux attenuation is completely due to in-situ remineralization, then degradation rates of unpoisoned material can be used to estimate sinking rates through comparison of remineralization length (time/space) scales… define remineralization length scale as e-folding scale (time or depth over which flux changes by 1/e):
The Martin Attenuation Curve is matched with exponential decay to zero, while Lutz Attenuation Curve is matched with exponential decay to a constant. Lutz Curve matches the data better (esp. if you include deep trap data)…but Martin Curve appears to require increasing bulk sinking rates, which is consistent with increasing importance of ballasting biomineral phases. Is Reality somewhere in between? sinking rate is constant in relation to remineralization sinking rate accelerates with depth!
VERTIGO Unpoisoned Particulate Degradation Experiments 1. quarter filter washed into incubation bottle using 0.2 µm filtered 500m water 2. water/particle mixture occasionally agitated, incubated at depth appropriate temperature in dark. 150m: 25 ºC; 300m: 15 ºC; 500m: 4 ºC 1d 2d t = 0 3d 5d 3. at particular times, incubation bottle agitated and aliquot removed by clean syringe. mixture is filtered on 0.2 µm PC, with liquid subsamples going for nitrification experiments (15NH4+), ICPMS and DOC. filters rinsed and dried for ICPMS. half PC filter washed onto Ag filter for POC.
Unpoisoned Remineralization Rates More elements showed remineralization in these experiments than in the poisoned experiment, but not all…
Sinking Rates for Comparison of Remineralization Rates and Attenuation Lengths (deployment 1) For elements where attenuation and remineralization both seen, the analysis suggests sinking rates comparable to those observed directly…remineralization can explain the vertical profiles! For the others, analysis suggests constrained fast or slow rates…either approach is breaking down or perhaps other factor important (particle type, grazing) slow=attenuation in flux profile seen, but little remineralization on 5 day timescale. fast=vertical profile doesn’t show much attenuation, but some remineralization seen. Martin, Lutz give comparable results.
Summary/Implications • Sediment traps were successfully used for trace level work for many elements. • In the quiet conditions of the N. Pacific Gyre, NBSTs and tethered traps mostly compared well. Some differences, with tethered often higher. • In-trap solubilization of most elements, as indicated by poisoned incubations, did not significantly alter flux estimates. • shallow traps, deployed for short times, generally not as affected as deep traps as suggested by Antia and others. • Though there appears to be something of a biological imprint on Fe cycling, Fe “remineralization length scales” are longer for Fe than C. • no catalytic effect can be expected for Fe additions in removing CO2. • Sinking rates suggested by matching unpoisoned remineralization rates and vertical flux attenuation are, for many particle constituents, consistent with direct sinking rate measurements. • this suggests that much of the control on the flux of this material was through mid-water remineralization processes. microbial and physical/chemical processes likely dominant. particle source/type and grazing less important.