Download
1 / 7
70 likes | 210 Views
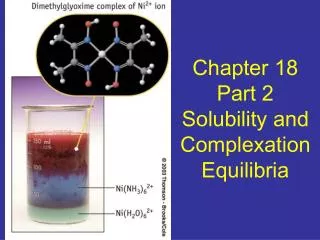
JYU. Applied Geochemistry & Lab Ch.6 Solubility Diagram. Part 1. 1. Definitions.

E N D
JYU Applied Geochemistry & LabCh.6 Solubility Diagram Part 1
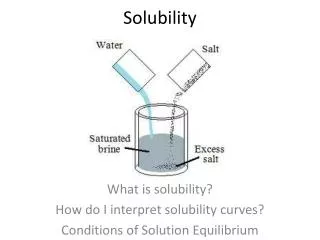
1. Definitions • Solubility: the property of a solid, liquid, or gaseous substance called solute to dissolve in another solid, liquid, or gaseous substance called solventto form a solution. This chapter specifically deals with solid solute in water to form aqueous solutions. The solubility also often means the extent of dissoslution. • Types of dissolution • Congruent dissolution: the composition of the dissolved solid matches that of solutes produced • Incongruent dissolution: doesn’t match
2. Calculation of the Solubility • For a dissolution reaction • ML = M+ + L- • Ksp = [M+][L-] • If there is neither M+nor L- preexisting in the solution • Let solubility=m, • Then, m=(Ksp)0.5 • If there is L- in [L-]’preexisting in the solution • [L-]=[L-]’+[M+] • Then, Ksp = [M+][L-] = [M+]2 + [M+] [L-]’ • [M+]=m, solve for m
3. Saturation • Precipitation vs. dissolution • Undersaturation dissolution • Oversaturation (supersaturation) precipitation • Saturation “equilibrium” • Expression of the saturation • Saturation ratio (SR) = IAP/Ksp • SR<1: US • SR>1: OS • SR=1: EQ • Saturation index (SI) = log(SR) • SI<0: US • SI>0: OS • SI=0: EQ • Affinity (A) = -RT*SI • A>0: US • A<0: OS • A=0: EQ
4. Solubility Diagram • Represent the boundaries of saturation of a solid in pH- metal conc. space • Procedures • Setup a system of interest • e.g. Al-O-H system • List possible species (including hydroxy complexes) • e.g. Al3+, AlOH2+, Al(OH)2+, Al(OH)30, Al(OH)4-, Al(OH)52- • Construct reactions between the solid phase and the each of the above species • Al(OH)3 (gibbsite) +3H+ = Al3+ + 3H2O (R1) • Al(OH)3 (gibbsite) +2H+ = AlOH2++ 2H2O (R2) • Al(OH)3 (gibbsite) +1H+ = Al(OH)2++ H2O(R3) • Al(OH)3 (gibbsite) = Al(OH)30 (R4) • Al(OH)3 (gibbsite) +H2O= Al(OH)4-+ H+ (R5) • Al(OH)3 (gibbsite) +2H2O = Al(OH)52-+ 2H+ (R6)
Calculate K values and express them in terms of pH and Al-conc for the above reactions • (R1) DGro = -11.29 kcal/mole K = 108.28 (by law of mass action), • log[Al3+]=-3pH +8.28 • (R2) DGro = -4.44 kcal/mole K = 103.26, • log[AlOH2+]=-2pH +3.26 • (R3) DGro = 1.39 kcal/mole K = 10-1.02, • log[Al(OH)2+]=-pH -1.02 • (R4) DGro = 9.16 kcal/mole K = 10-6.72, • log[Al(OH)30]=-6.72 • (R5) DGro = 20.5 kcal/mole K = 10-15.1, • log[Al(OH)4-]=pH -15.1 • (R6) DGro = 35.41 kcal/mole K = 10-26.0, • log[, Al(OH)52-]=2pH -26.0